Updated 9th April 2022
This article has not been updated recently
COVID not showing signs of dropping


According to ZOE COVID Study incidence figures, in total there are currently 58,126 new daily symptomatic cases of COVID in the UK on average, based on PCR and LFT test data from up to five days ago [*]. An increase of 22% from 45,081 new daily cases last week.
In the fully vaccinated population, it’s estimated there are currently 14,352 new daily symptomatic cases in the UK. Cases in this group have slightly increased from 13,118 cases last week (Graph 1).
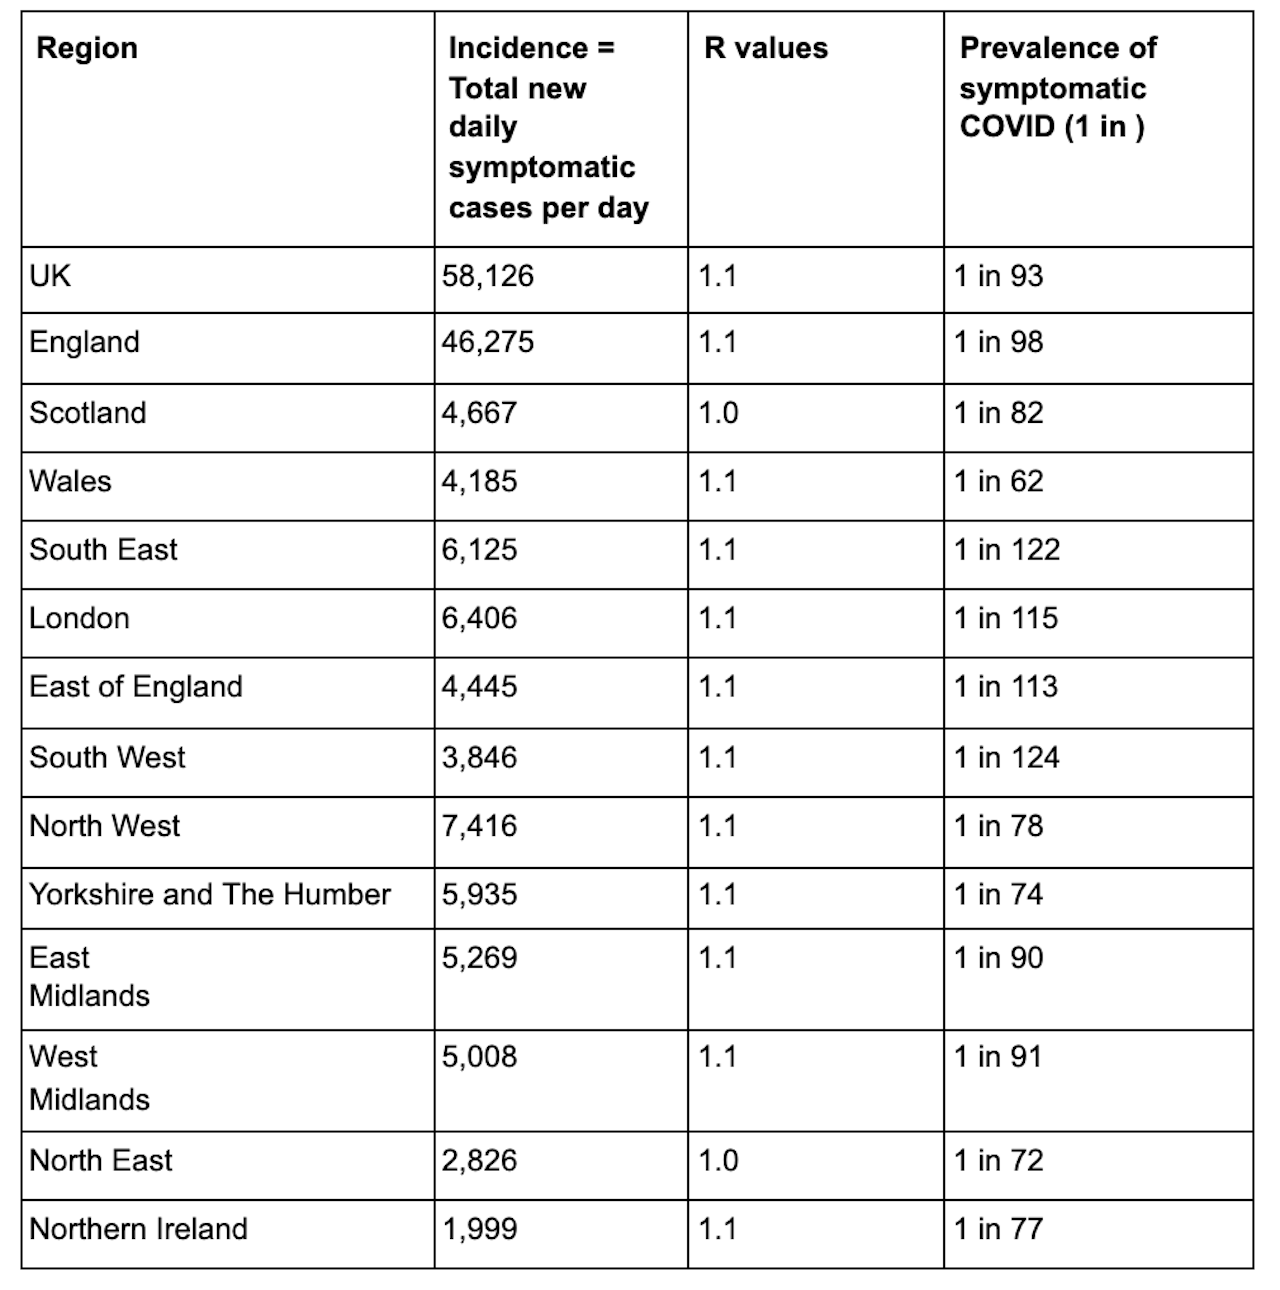
In terms of prevalence, on average 1 in 93 people in the UK currently have symptomatic COVID (Table 1).
Across the different age groups, there has been an uptick in the number of active cases in people aged 20-50, but cases continue to increase most in the under 19s. Cases remain low and stable in contributors over the age of 50 (Graph 2).
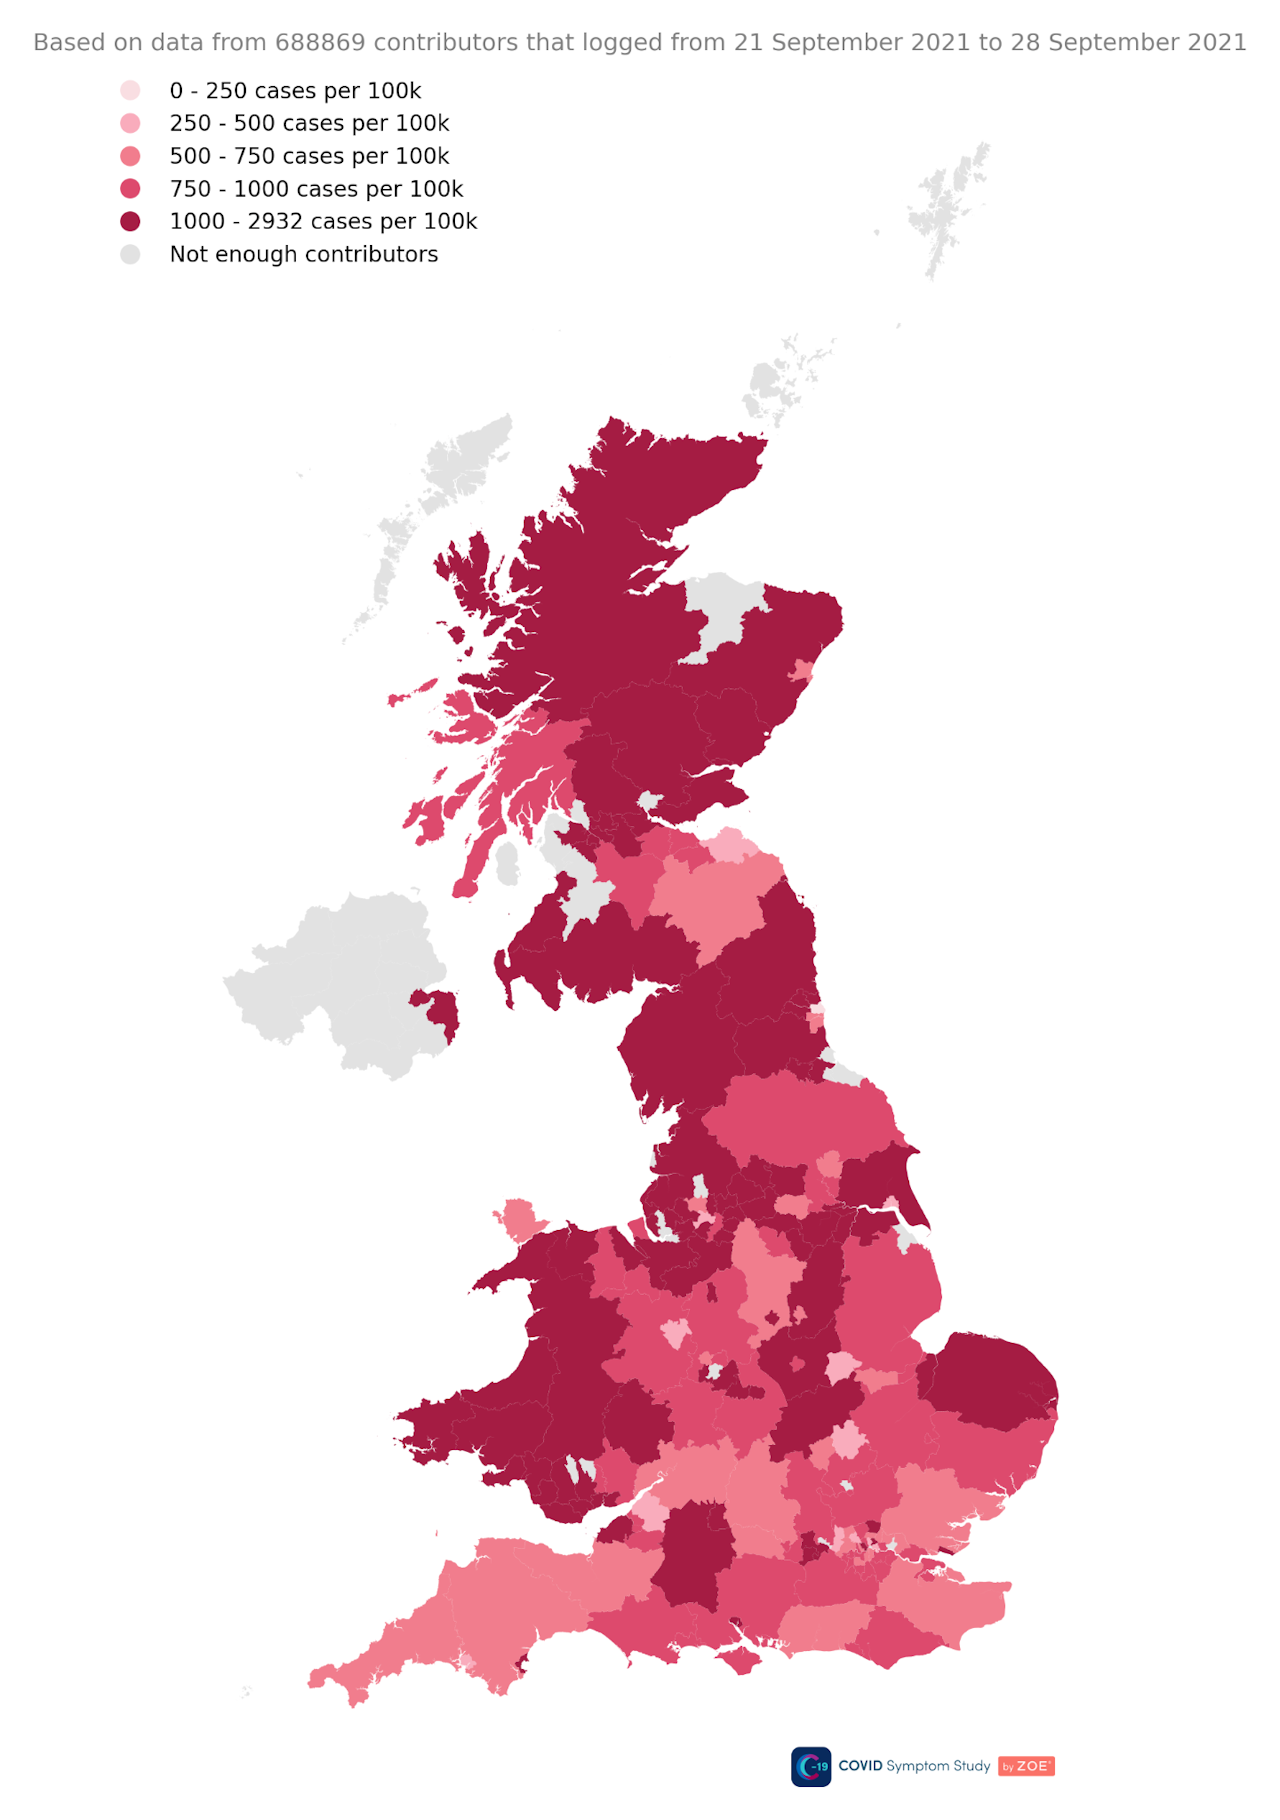
The UK R value is estimated to be around 1.1 and regional R values are; England, 1.1, Wales, 1.1, Scotland, 1.0 (Table 1). Prevalence figures in the regions show that all regions are currently seeing an uptick in new cases, particularly in Wales, which after having some of the lowest levels, now has the highest number of cases (Graph 3).
ZOE’s predicted Long COVID incidence rate currently estimates, at current case rates, 804 people a day will go on to experience symptoms for longer than 12 weeks (Graph 4).
The ZOE COVID Study incidence figures (new symptomatic cases) are based on reports from around 750,000 thousand weekly contributors and the proportion of newly symptomatic users who have received positive swab tests. The latest survey figures were based on data from 39,742 recent swab tests done between 11th and 25th September 2021.
Professor Tim Spector, lead scientist on the ZOE COVID Study app, comments on the latest data:
“While the latest ZOE data shows new cases are up on last week, it’s encouraging to see national hospitalisation rates falling as we approach winter. While most cases are still in the young, we’re seeing infections being passed up the generational ladder, likely from school children to their parents. Most of these new adult infections are in the under 50s, who still have a relatively low risk of being admitted to hospital, especially if they’ve been fully vaccinated.
As the winter approaches, it’s important parents of school-aged children and students don’t pass the virus on to more vulnerable grandparents by not recognising simple cold-like symptoms as a possible COVID infection. This is a critical time and a little caution could make all the difference in avoiding a winter crisis for hospitals.”
Graph 1. The ZOE COVID Study UK incidence figures results over time; total number of new cases and new cases in fully vaccinated


Graph 2. Prevalence by age group

Graph 3. Prevalence by region

Graph 4. Predicted Long COVID incidence over time
Please refer to the publication by Thompson at al. (2021) for details on how long covid rates in the population are modelled

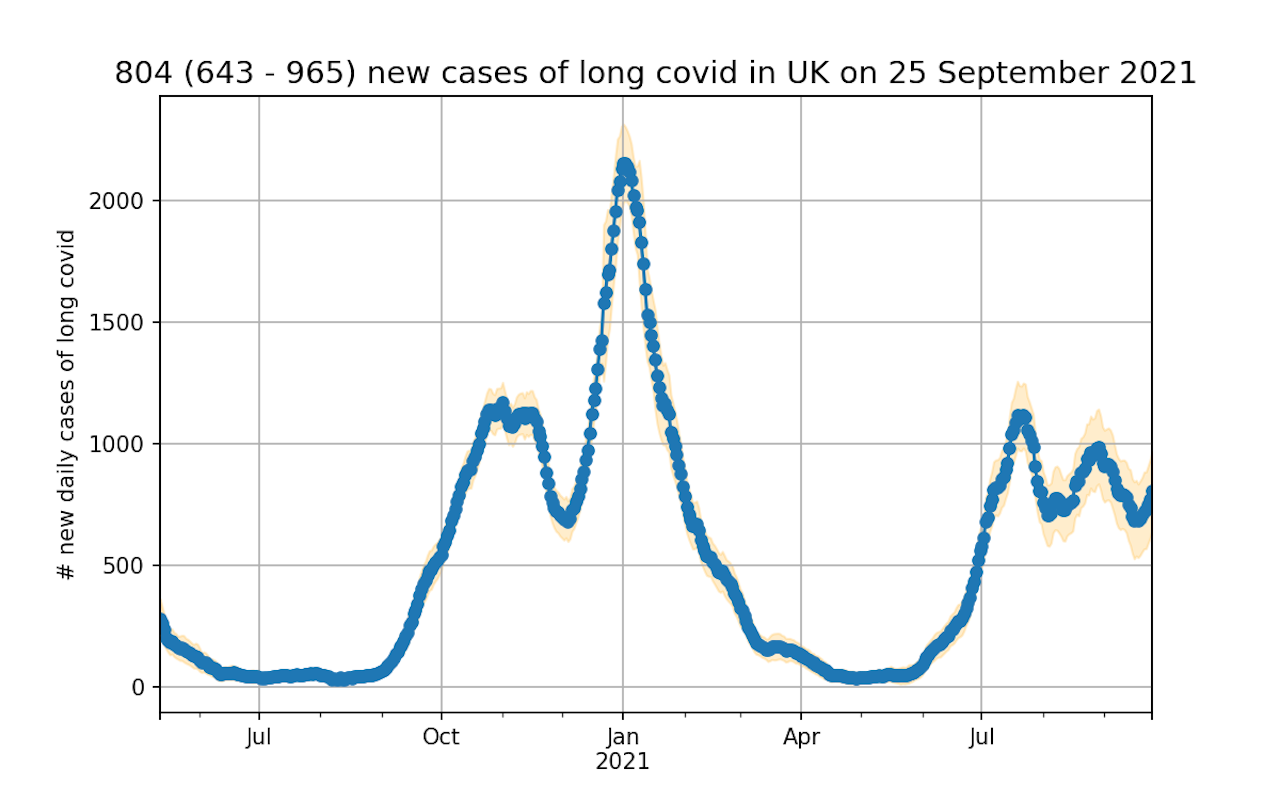
Table 1. Incidence (daily new symptomatic cases)[*], R values and prevalence regional breakdown table

Map of UK prevalence figures