Updated 9th April 2022
This article has not been updated recently
Worryingly close to 100,000 new cases a day


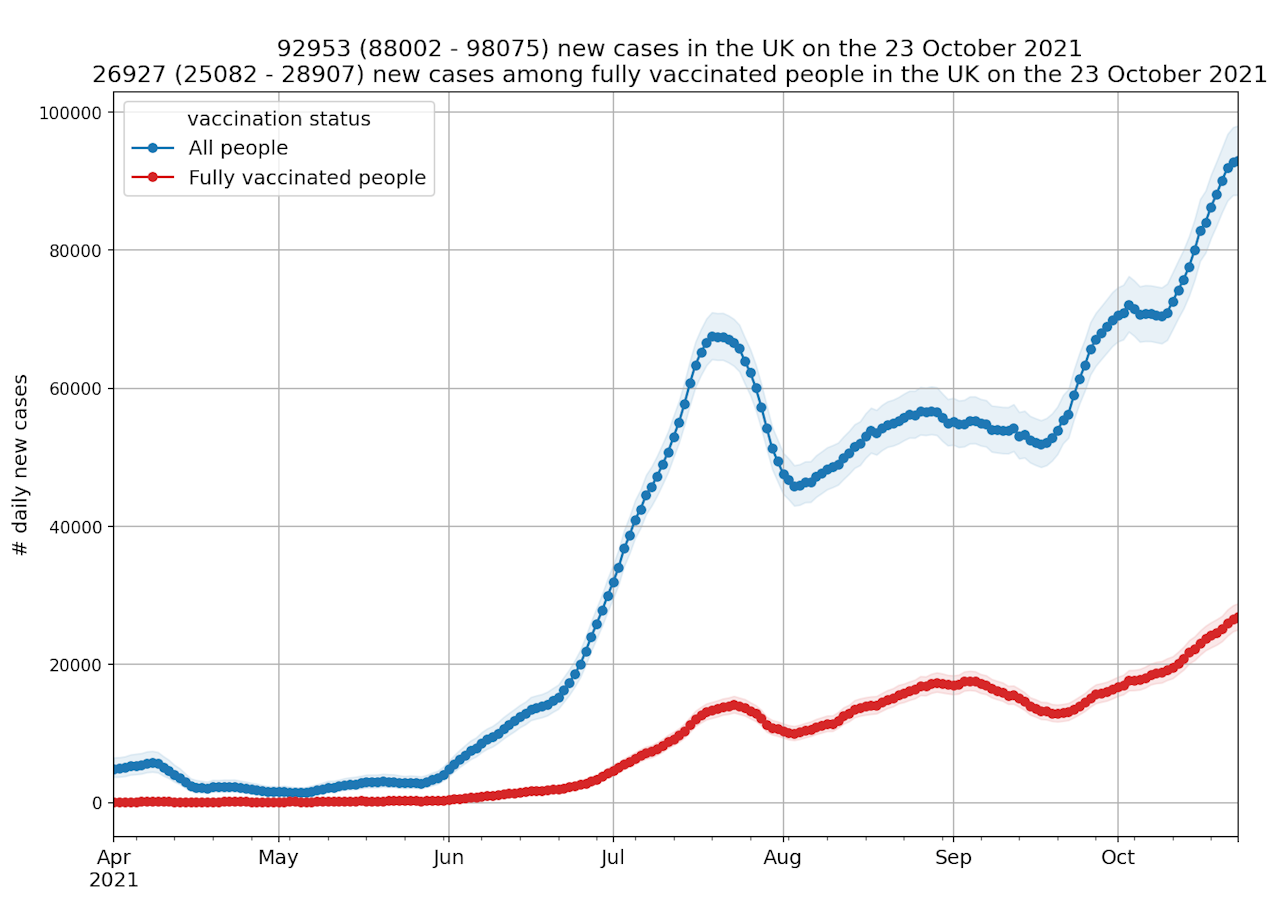
According to ZOE COVID Study incidence figures, in total there are currently 92,953 new daily symptomatic cases of COVID in the UK on average, based on PCR and LFT test data from up to five days ago [*]. An increase of 14% from 81,823 new daily cases last week.*
In the double vaccinated population cases continue to rise and it’s estimated there are currently 26,927 new daily symptomatic cases in the UK up from 23,199 cases last week (Graph 1).
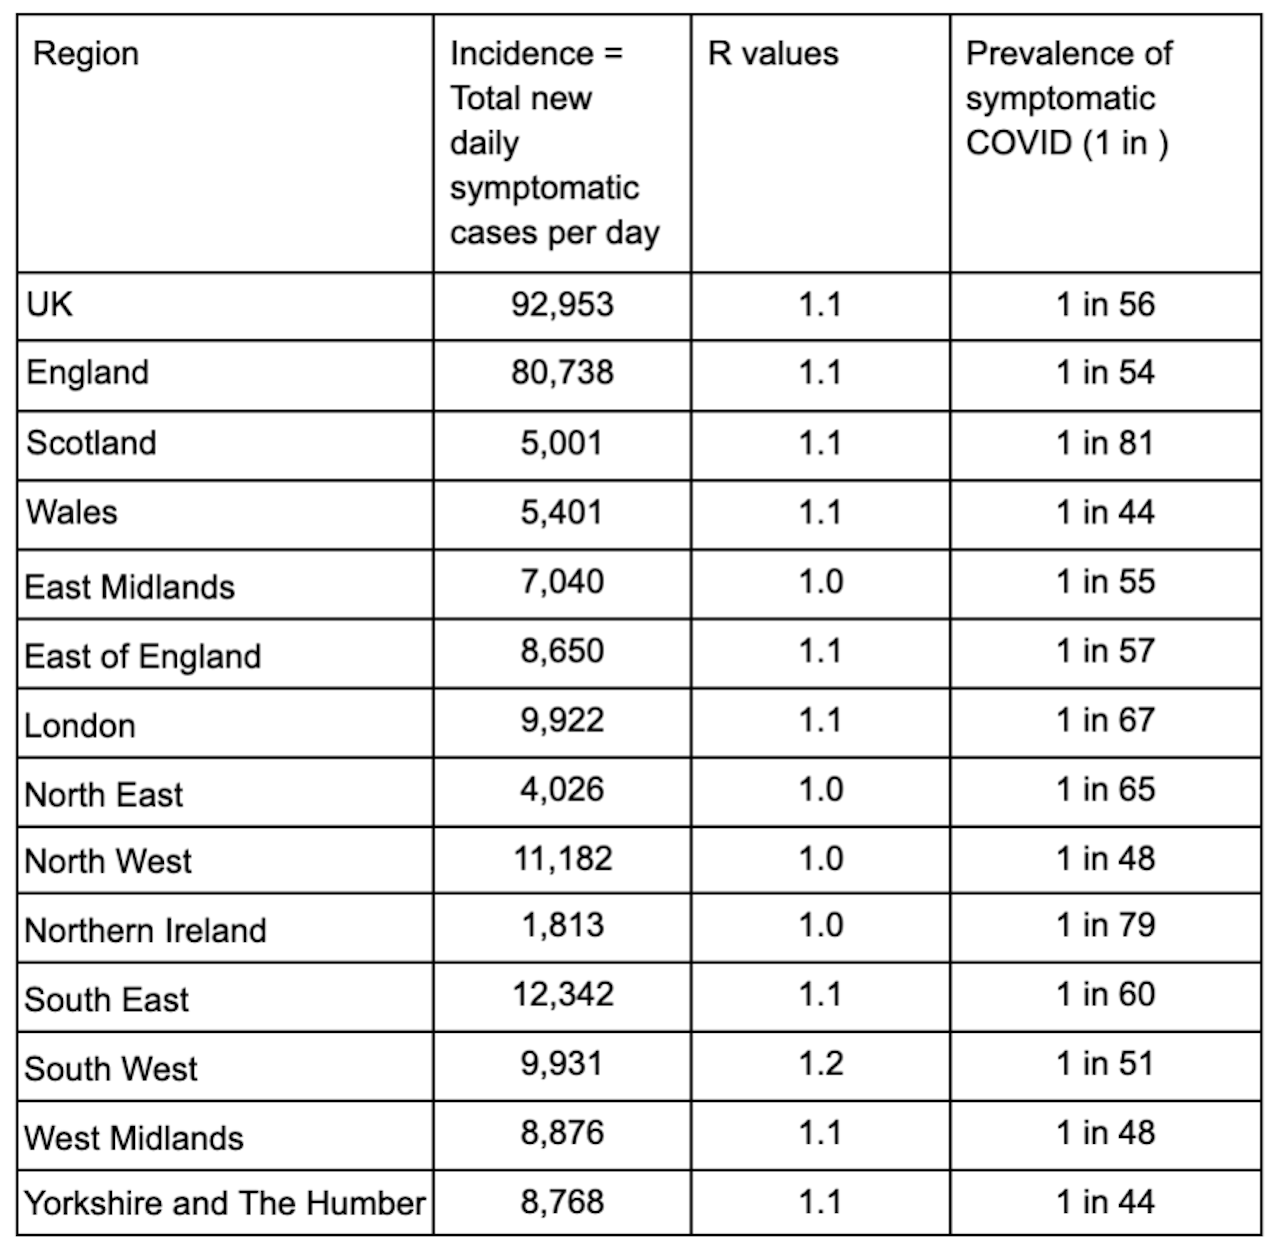
The UK R value is estimated to be around 1.1 and regional R values are; England, 1.1, Wales, 1.1, Scotland, 1.1 (Table 1).
The ZOE incidence data is always a week ahead of the other surveillance surveys and continues to work as an early warning signal. The ZOE data has been reporting an uptick in cases for the last month and the latest ONS survey figures also reflect this trend and the high numbers (Graph 5).
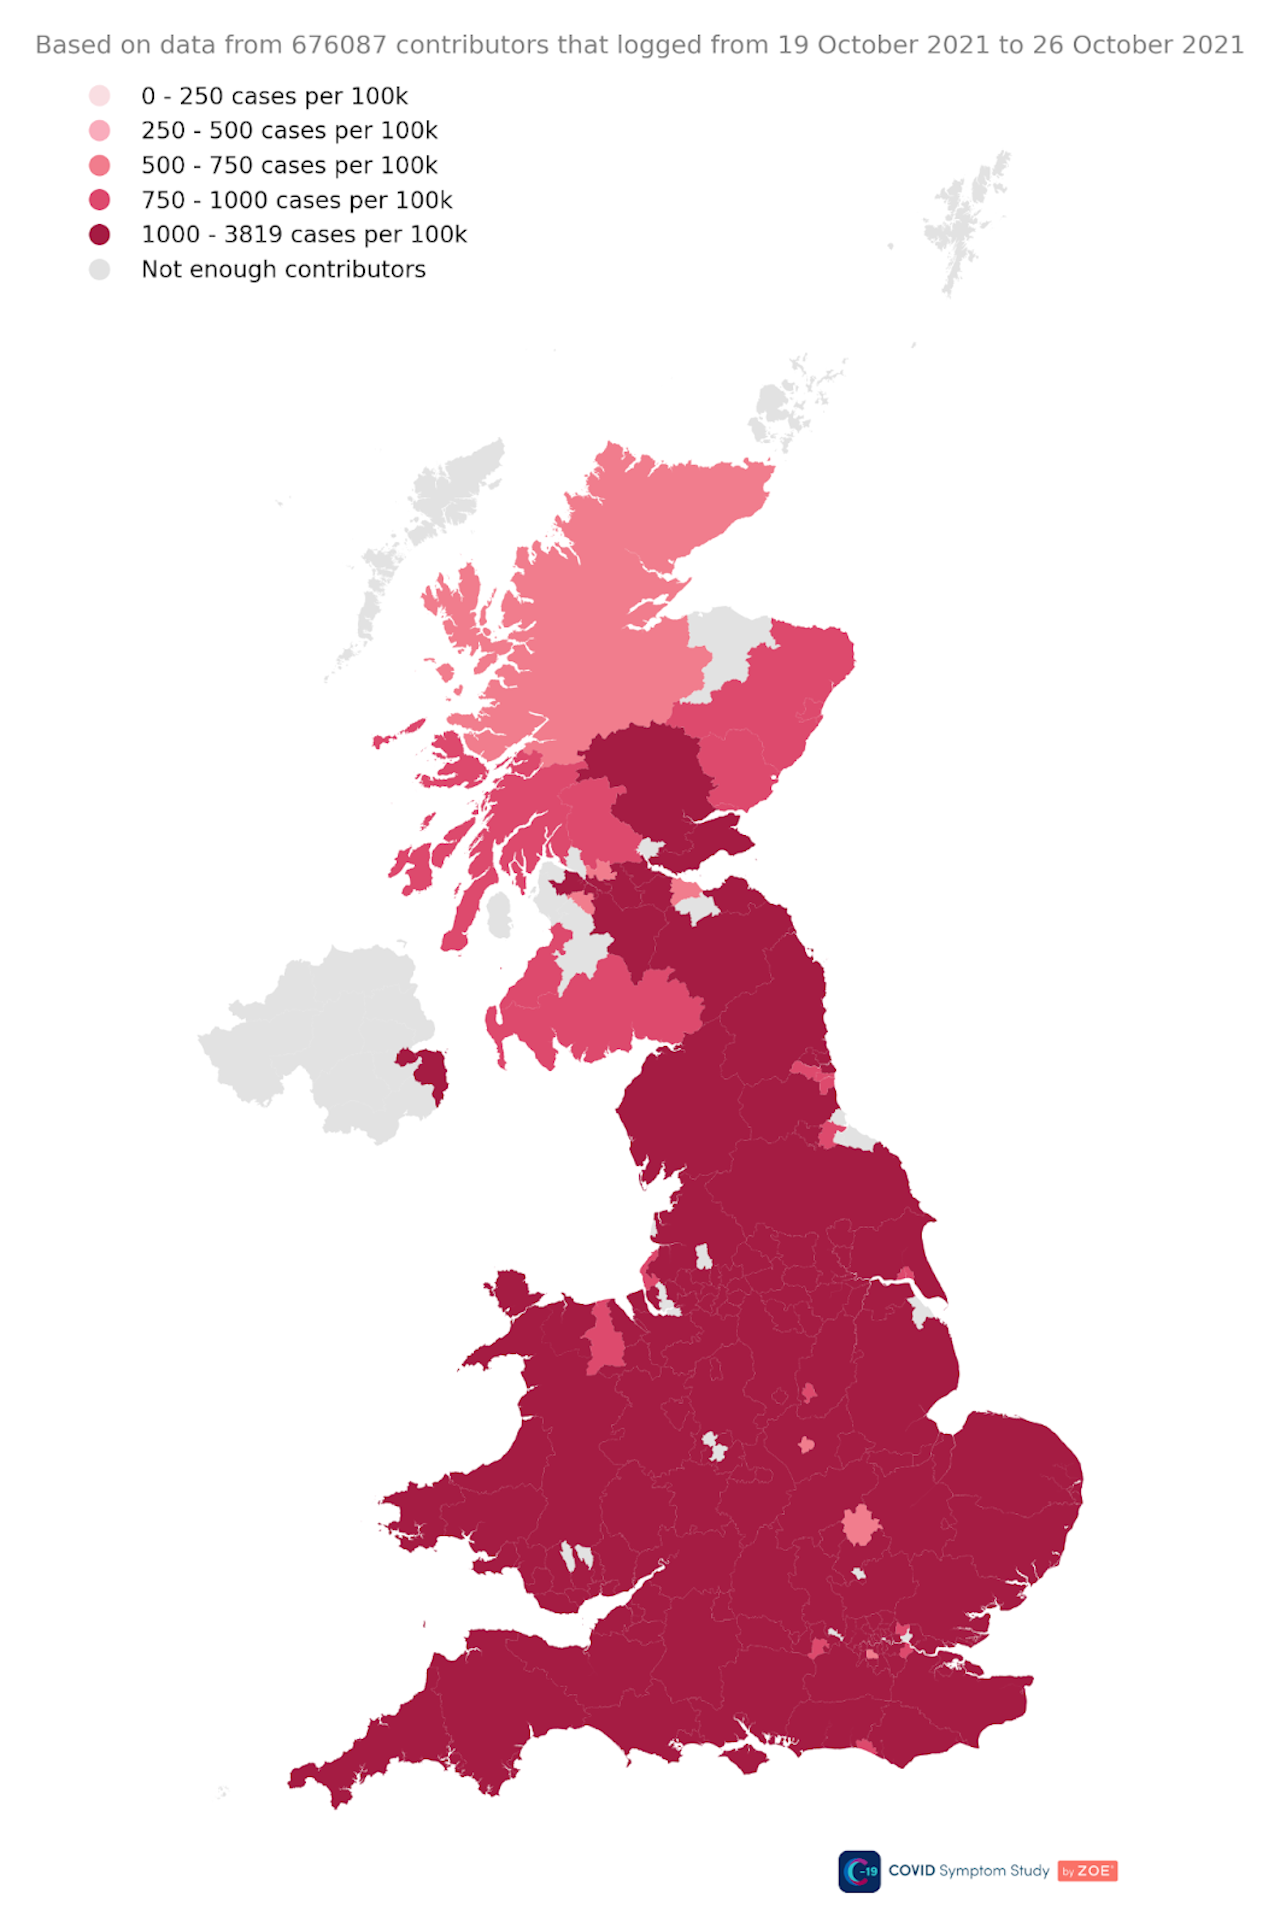
In terms of prevalence, on average 1 in 56 people in the UK currently have symptomatic COVID. In the regions, England, 1 in 54. Wales,1 in 44. Scotland, 1 in 81. (Table 1).
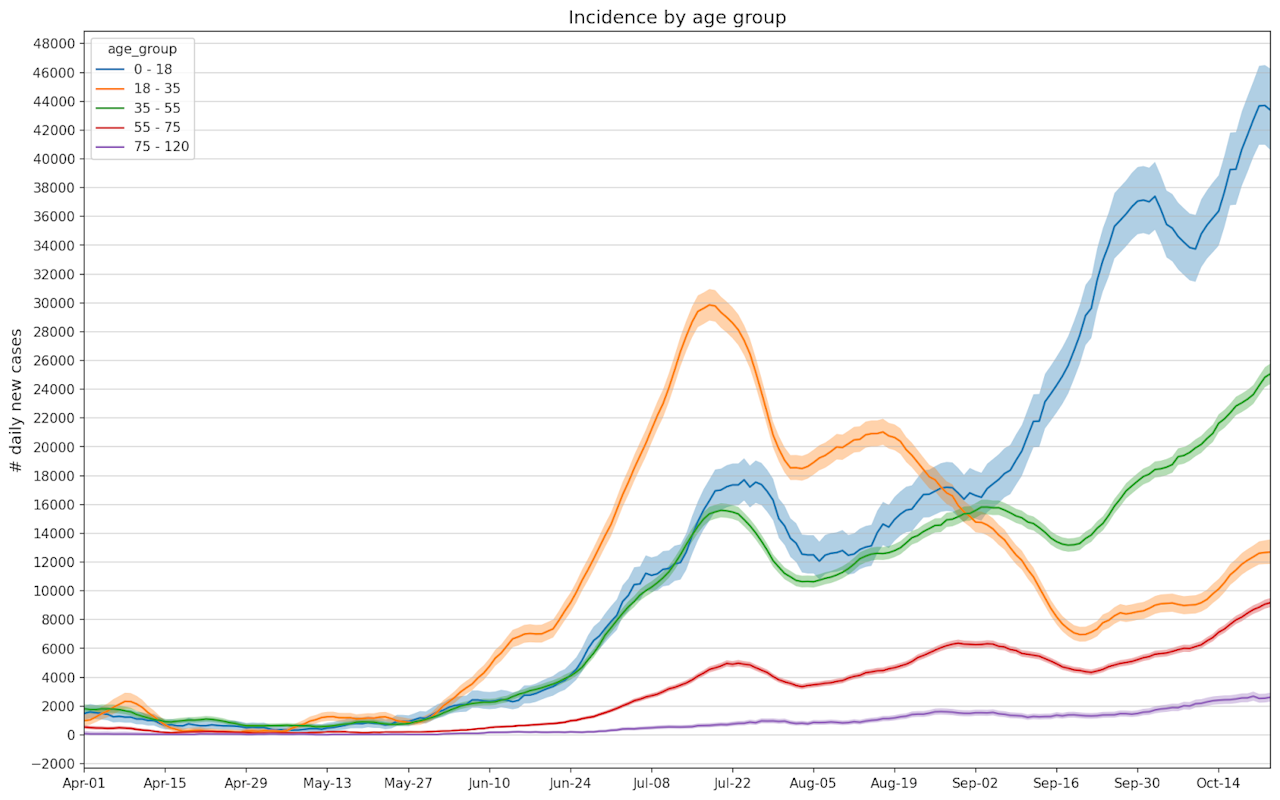
Cases are rising across all age groups, although the proportion of cases remains highest in 0-18 year olds. In the last week there has been an uptick in the rate of increase in the more vulnerable age groups (55-75) that are more likely to be hospitalised (Graph 2).
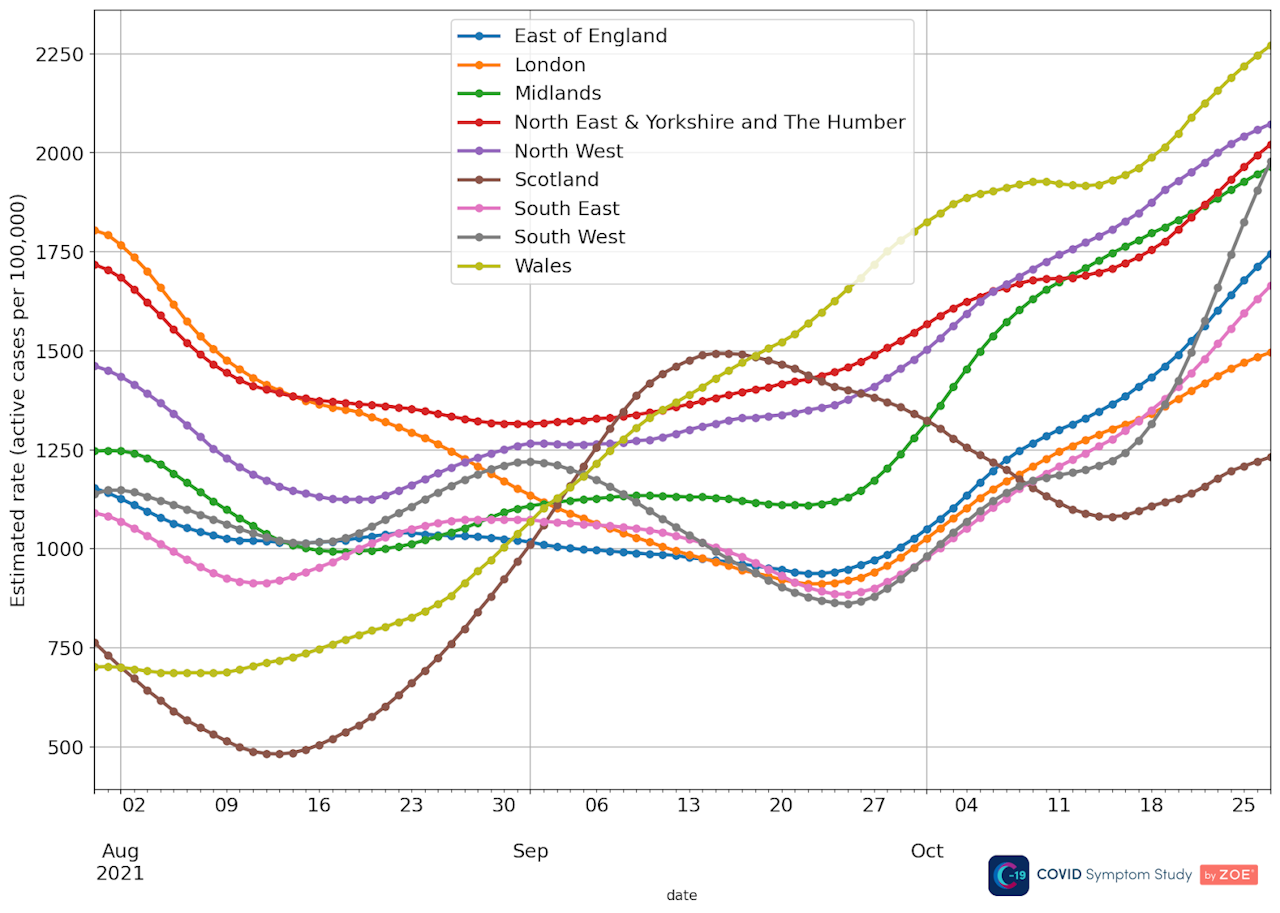
In terms of prevalence, cases are high in all regions of the UK, while there has been a notable steep rise in cases in the South West (Graph 3).
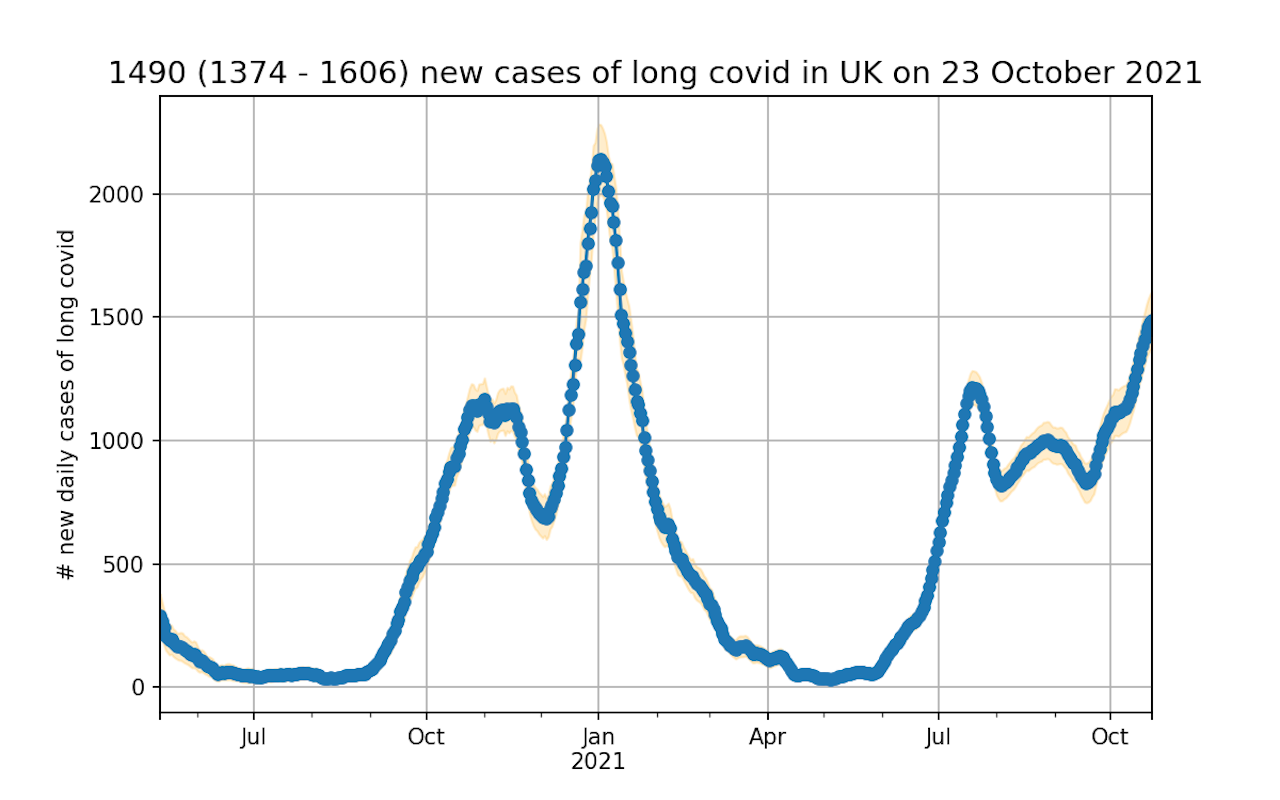
ZOE’s predicted Long COVID incidence rate currently estimates, at current case rates, 1,490 people a day will go on to experience symptoms for longer than 12 weeks (Graph 4).
The ZOE COVID Study incidence figures (new symptomatic cases) are based on reports from around 750,000 thousand weekly contributors and the proportion of newly symptomatic users who have received positive swab tests. The latest survey figures were based on data from 42,795 recent swab tests done between 9 October and 23 October 2021.
Professor Tim Spector, lead scientist on the ZOE COVID Study app, comments on the latest data:
“The ZOE data shows the UK could hit 100,000 new cases sooner than expected and with no sign of a Plan B or Plan C. The ZOE figures are consistently higher than the official confirmed daily cases because we get results from various sources, including self-reported lateral flow tests that are under-reported officially. The government raw figures report on PCR testing of the classical symptoms only, which miss around 40 percent of cases. ZOE extrapolates the data from our sample to predict daily infections in the wider population. With the confirmation of our estimates from the ONS’s fortnightly survey, it’s clear the government figures are a big under-estimate, and with the highest rates in Western Europe, there’s no room for complacency.
With the UK government delaying any decision while hospitals fill up, it's time to take matters into our own hands to address the worsening situation. Public action has worked in previous waves to reduce rates before lockdowns. Firstly, we need to encourage everyone to get vaccinated. Our rate of 67 percent in total is just not good enough compared to other countries; all those eligible for a booster vaccine should get one now. ZOE data has shown vaccine protection is waning and boosters will further cut the number of vaccinated people (who make up almost a third of daily cases) getting infected.
We now know that masks add a layer of protection, so wearing them on public transport and in crowded places is a good idea. Avoiding unventilated crowded events is another, as well as working more from home. Finally, staying at home and getting tested when you feel unwell is key. There’s a lot of cold and flu out there making it harder than ever to tell the difference between a harmless cold or COVID. However, there are some symptoms that are very telling of COVID, particularly loss of smell and taste. If you feel ill, always check by taking a quick and easy Lateral Flow Test, even if you think it’s just a cold.”
Graph 1. The ZOE COVID Study UK incidence figures results over time; total number of new cases and new cases in fully vaccinated

Graph 2. Incidence by age group

Graph 3. Prevalence by region

Graph 4. Predicted Long COVID incidence over time
Please refer to the publication by Thompson at al. (2021) for details on how long covid rates in the population are modelled
Graph 5. A comparison of prevalence figures; ZOE COVID Study, and other COVID surveillance studies

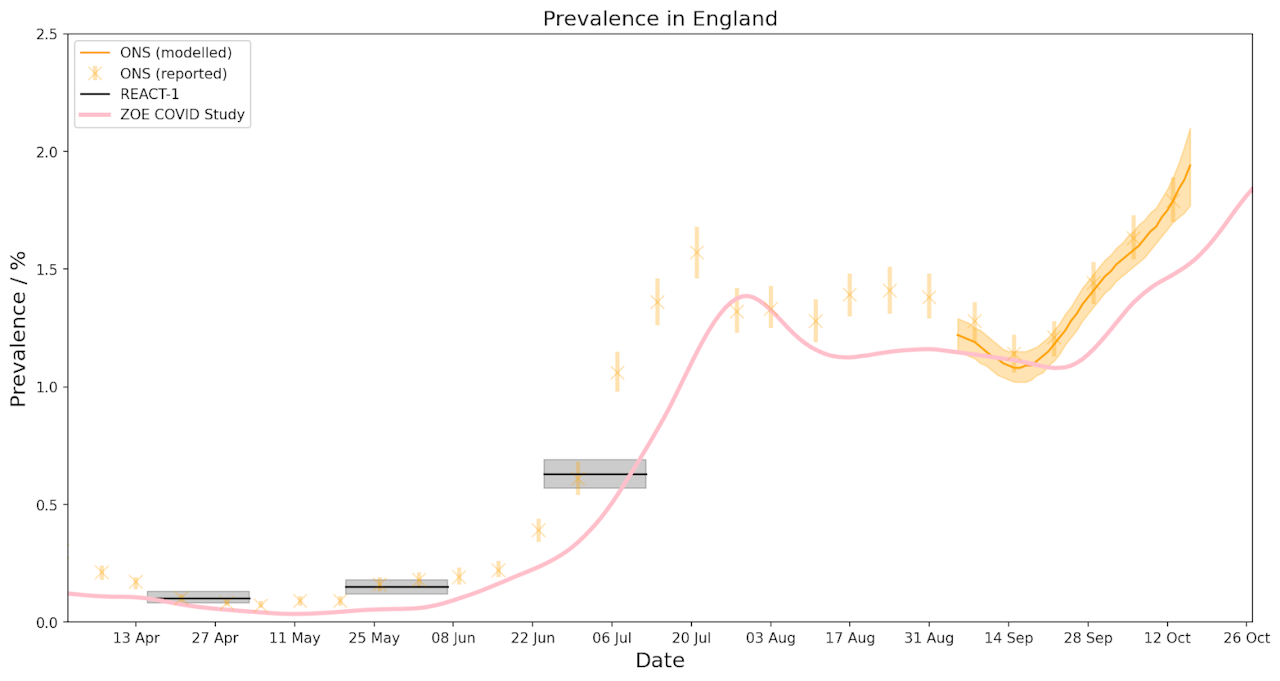
Table 1. Incidence (daily new symptomatic cases)[*], R values and prevalence regional breakdown table

Map of UK prevalence figures