Updated 9th April 2022
This article has not been updated recently
January's drop in cases is starting to slow


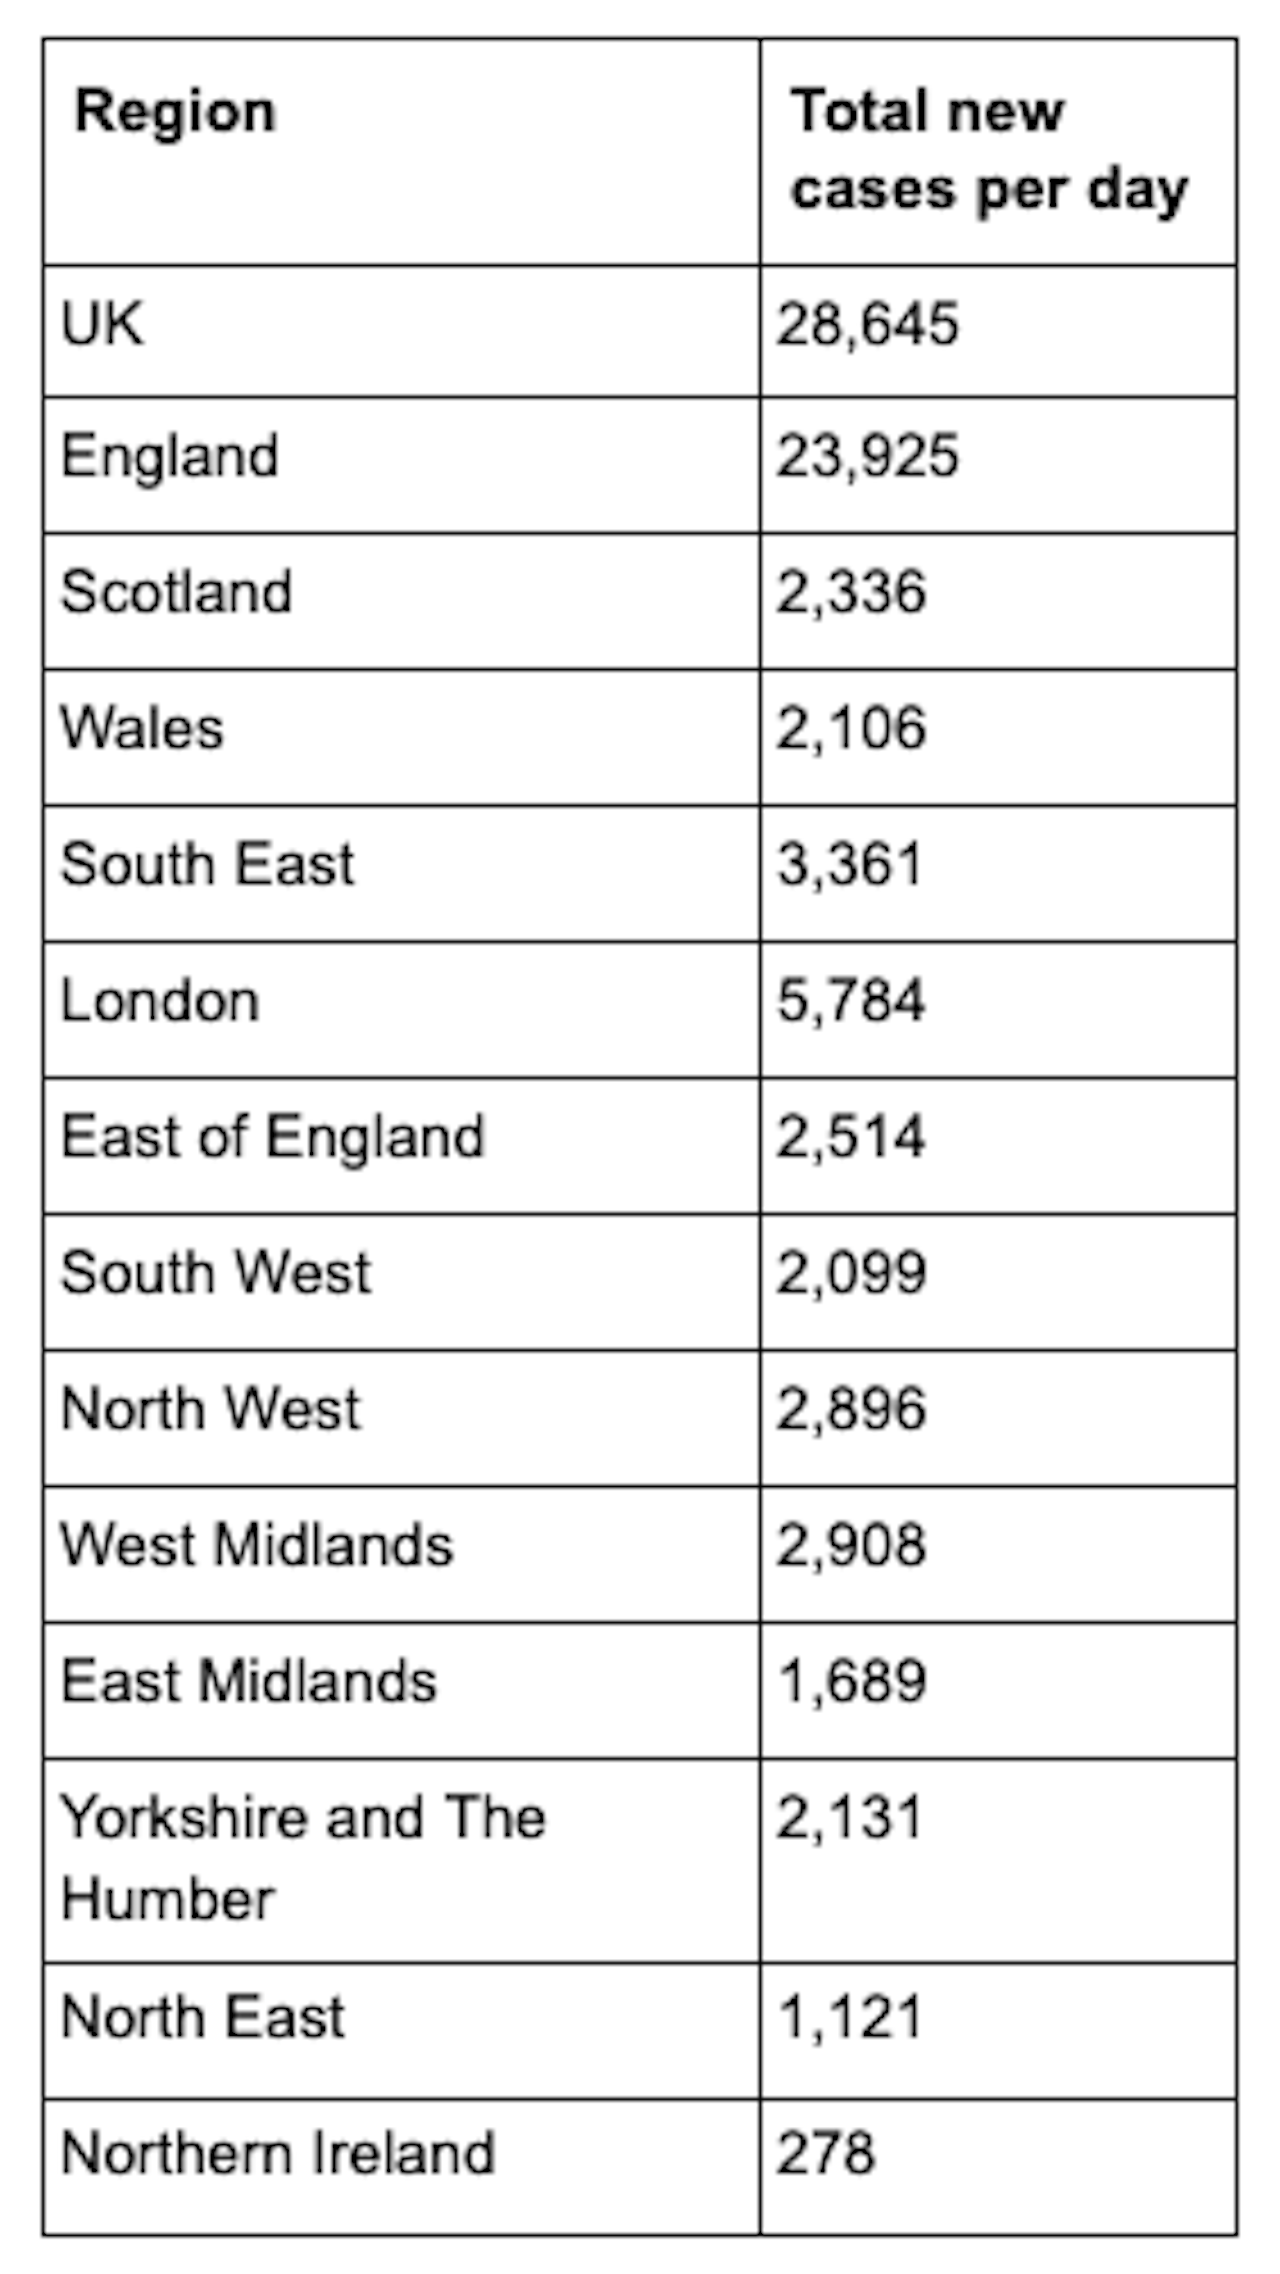
According to the ZOE COVID Symptom Study UK Infection Survey figures, there are currently, 28,645 daily new symptomatic cases of COVID in the UK on average, based on swab tests data from up to five days ago [*], This compares to 34,133 daily new symptomatic cases a week ago, a decrease of 22%. Since the peak of 69,000 daily new cases around the 1st January, cases have fallen by 60%. (Full table of regional results below). In terms of prevalence, on average 1 in 134 people in the UK currently have symptomatic COVID.
Other key findings from ZOE COVID Symptom Study UK Infection Survey this week:
The UK R value is 0.9
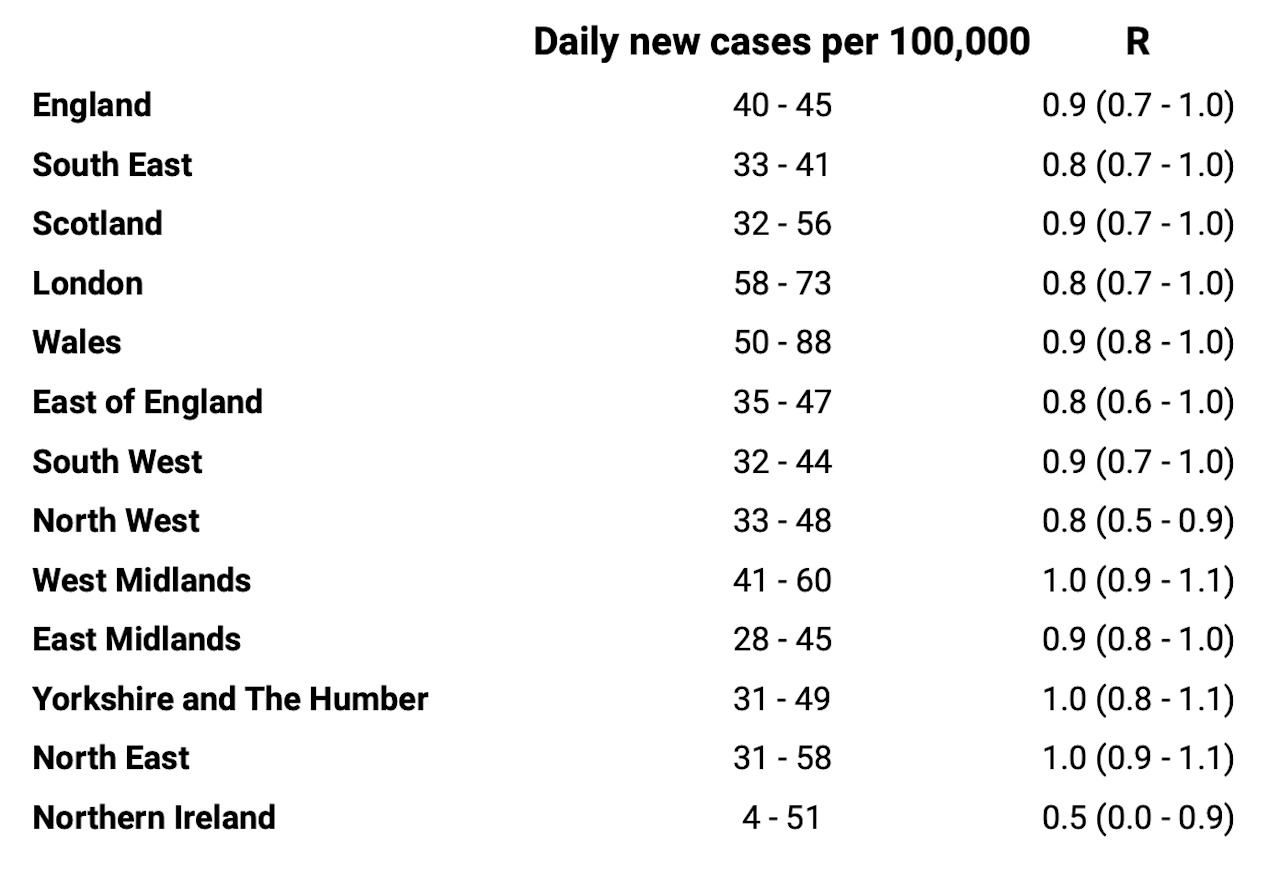
Regional R values are: England, 0.9. Wales, 0.9. Scotland, 0.9. (full table below)
Daily new cases are falling in all regions of the UK with all R values of 0.9, but the pace of decline has slowed down
The R value has gone up to 1.0 in West Midland, East Midlands and North East
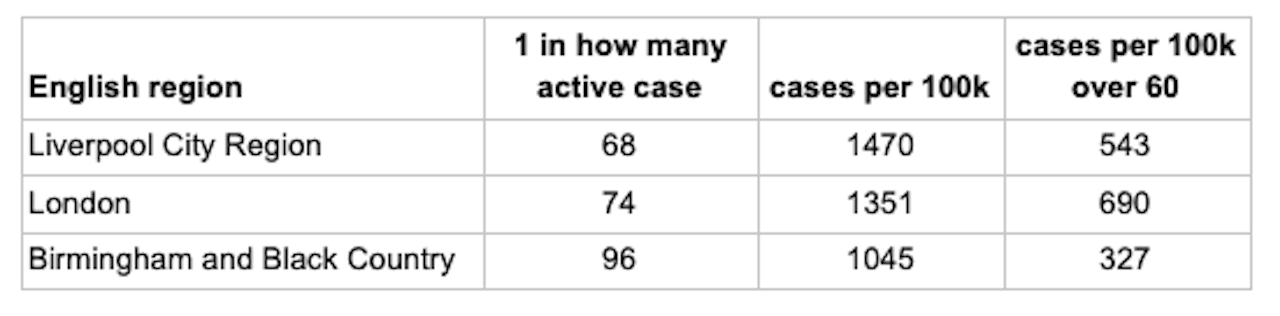
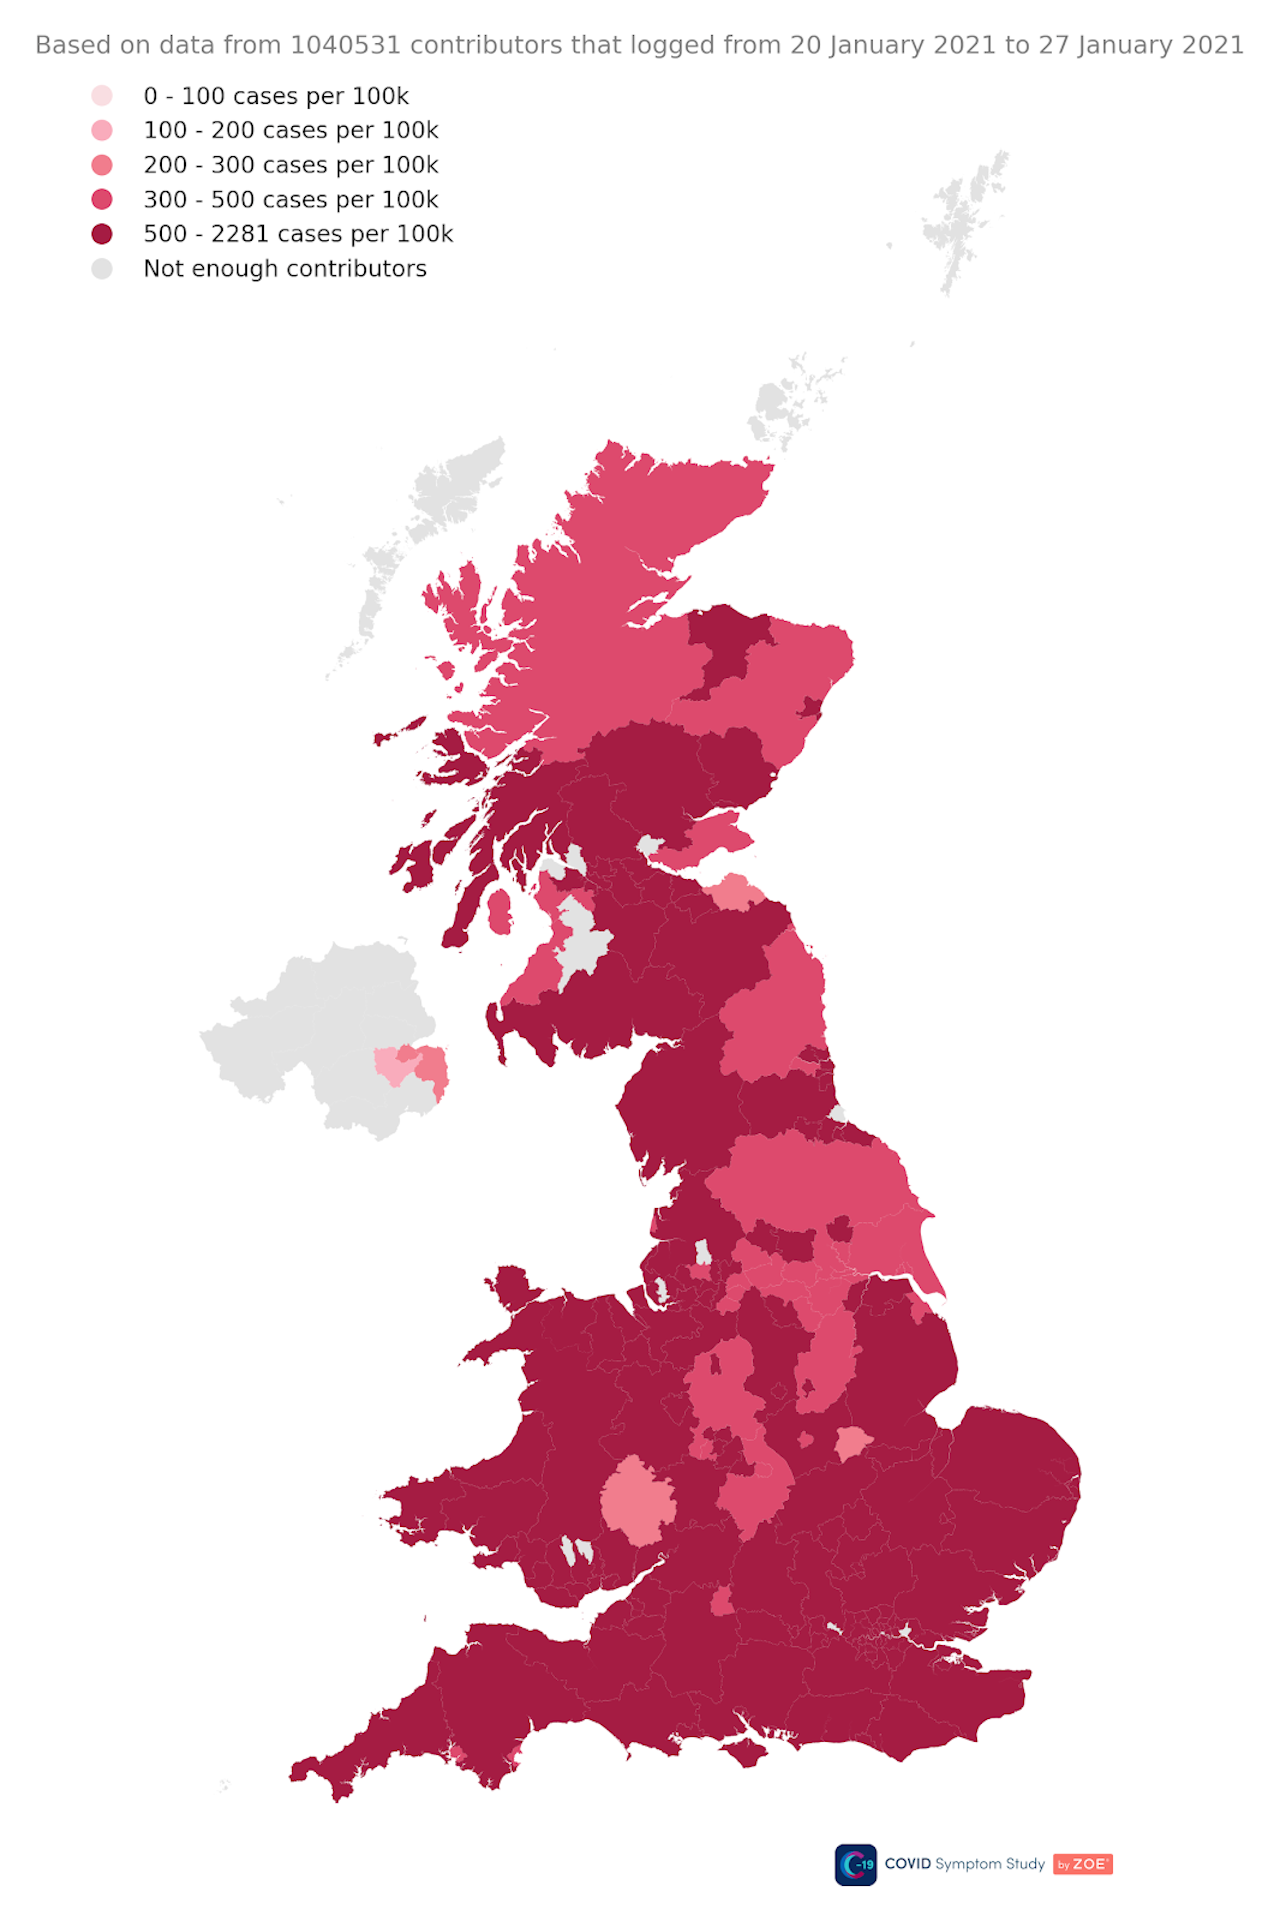
The highest risk areas in the UK are currently, Liverpool (1 in 68), London (1 in 74) and Birmingham and Black Country (1 in 96) (full tables of results below)
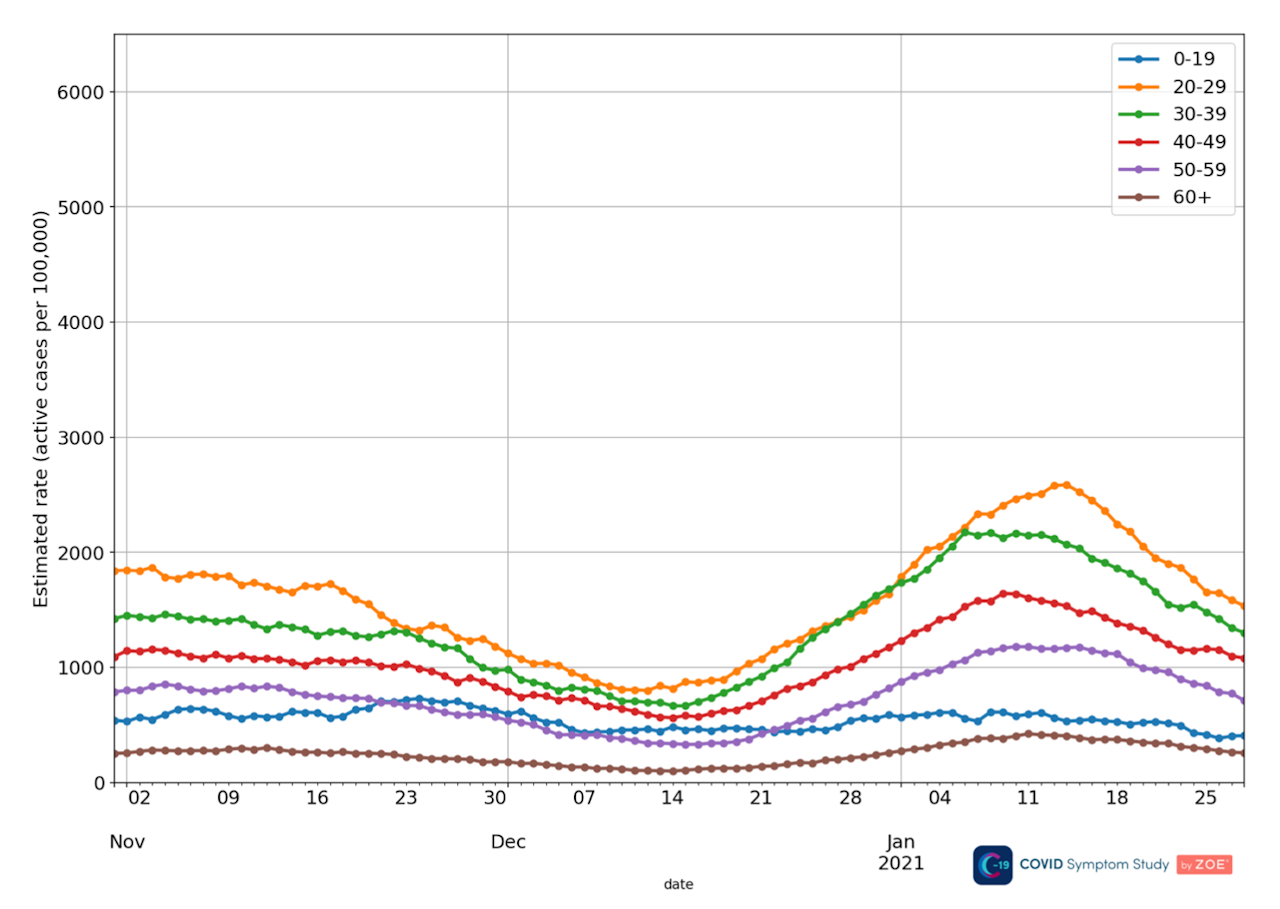
Cases are still coming down in the 20-49 year olds that form the majority of cases, but more slowly in the 0-19 and 60+ age groups (see graph below)
The ZOE COVID Symptom Study UK Infection Survey figures are based on around one million weekly reporters and the proportion of newly symptomatic users who have positive swab tests. The latest survey figures were based on data from 16,353 recent swab tests done between 10 to 24 January 2021.
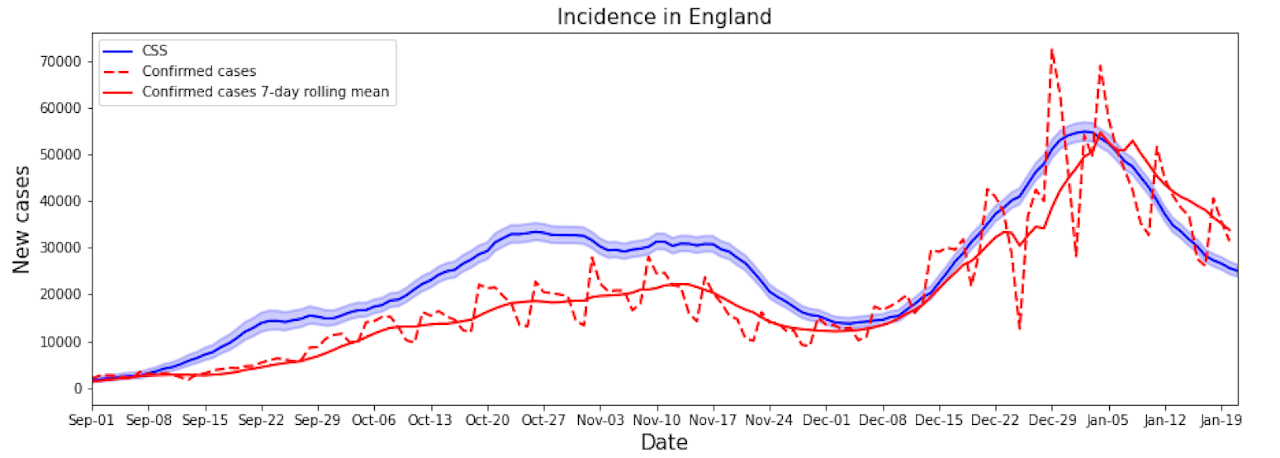
There are four different sources of data on COVID-19 in the UK, ZOE, ONS, REACT1 and confirmed cases. The ZOE COVID Symptom Study UK Infection Survey reports on the number of daily new symptomatic cases (incidence).
All four sources have a vital role to play in monitoring COVID-19 in the UK and providing regular updates . The ZOE CSS reports on daily new cases, which gives an up-to-date view of the infection trends as reported by all those who participate in the app. The REACT 1 study measures prevalence of infection and gives an estimate of R across a two-week period each month, from randomly sampling the population to identify cases in the community. Whereas the ONS’s Covid Infection Survey measures positivity rates in a form similar to prevalence, providing weekly updates on households it tracks over time. So all studies are measuring slightly different data but all have an essential role to play. When the data is compared the overarching trend in the studies align and are roughly reporting the same picture. See graphs below for direct comparison.
Tim Spector OBE, lead scientist on the ZOE COVID Symptom Study app and Professor of Genetic Epidemiology at King’s College London, comments on the latest data:
“Cases are still falling which is good news but there are signs that this 60% decrease is running out of steam with some areas already starting to see R values creep back up to 1.0. With the number of active cases (prevalence) at 520,000 and falling slowly, the risk of infection remains high and so it's important to continue with social measures to reduce transmission. We need to remember there are other early symptoms of the virus such as headache, fatigue and sore throat. If more people self-isolated and got tested when experiencing these we’d be able catch people earlier and reduce transmission. People reporting these symptoms in the ZOE app, not just the classic three, will be offered a test. Hospital admissions are now easing slightly, which is good news and is in line with our predictions as cases have been falling for the last three weeks. With the continued roll out of the vaccine to hospital staff, the older and most vulnerable, we are hopeful that we will start to see a real impact on infection levels and hospital pressure soon.”
COVID-19 survey comparison graphs:


Worst affected region in England:

Incidence / Daily new symptomatic cases regional breakdown [*]

The ZOE COVID Symptom Study UK Infection Survey results over time for the UK

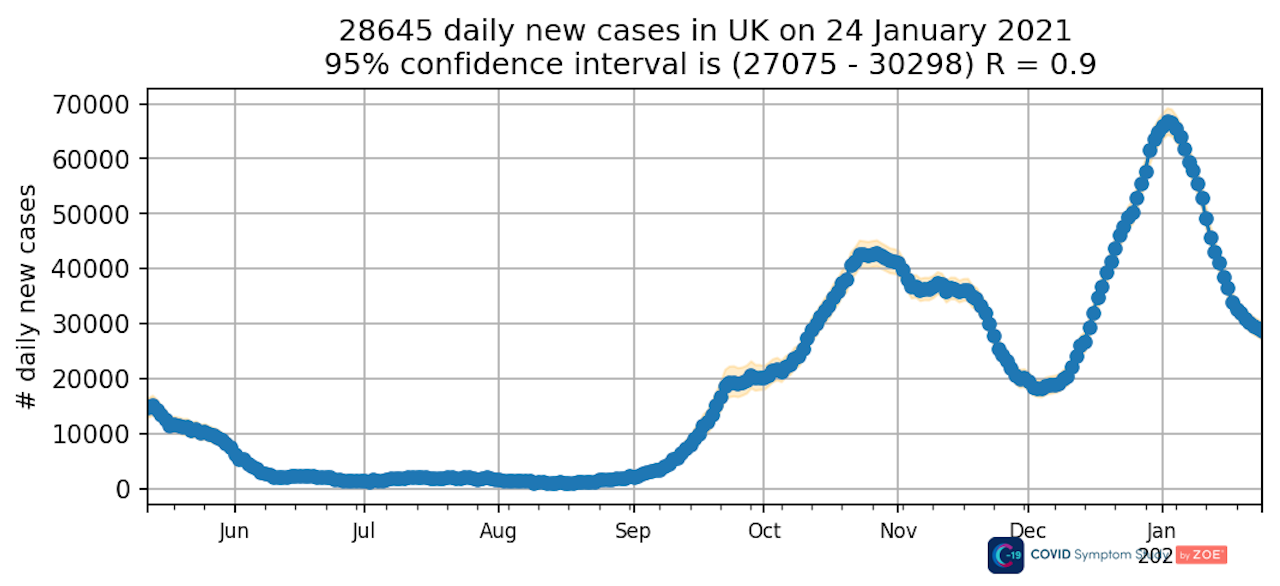
Table of R Values

Map of UK prevalence figures

Estimated rate of people with Symptomatic COVID across age groups