Updated 9th April 2022
This article has not been updated recently
COVID cases have probably peaked for 2021


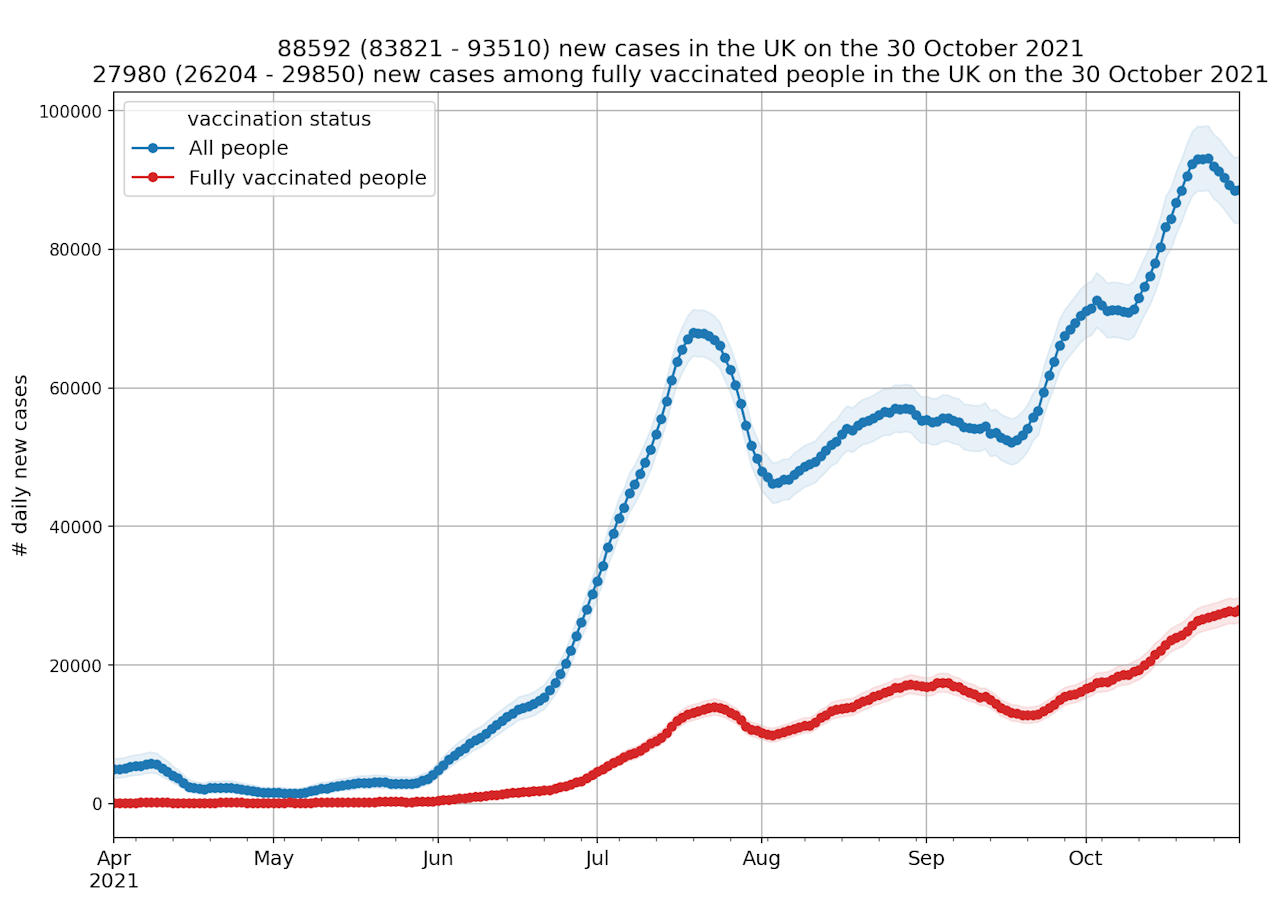
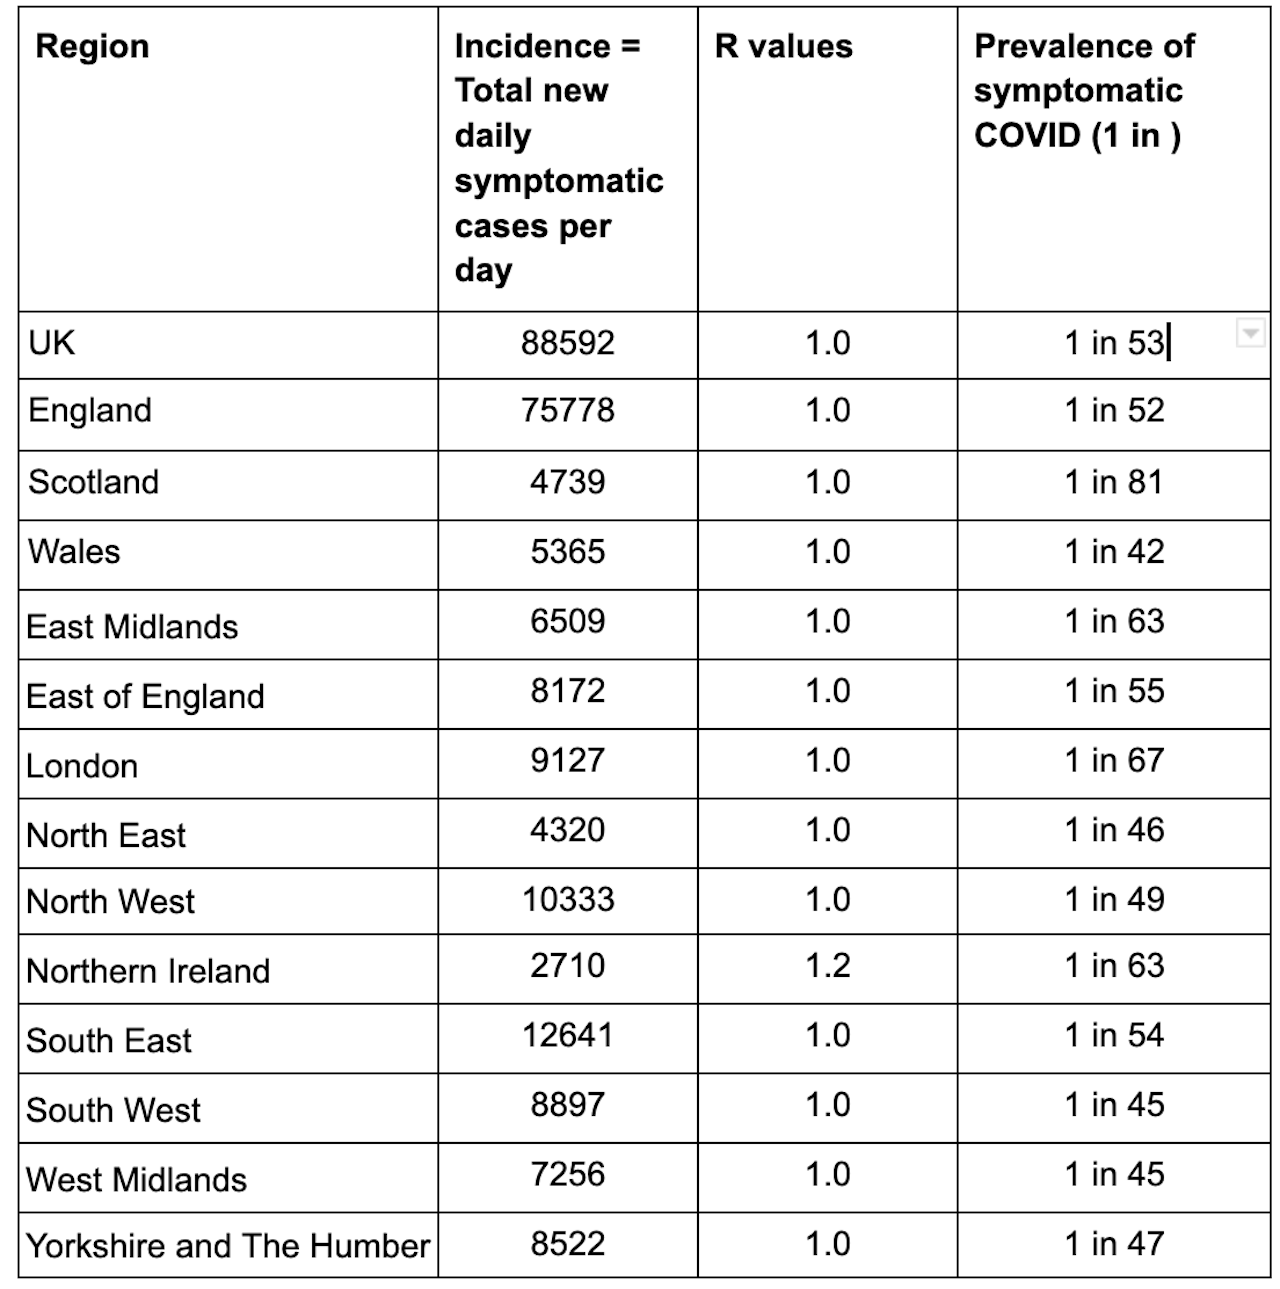
According to ZOE COVID Study incidence figures, in total there are currently 88,592 new daily symptomatic cases of COVID in the UK on average, based on PCR and LFT test data from up to five days ago [*]. A decrease of 4.7% from 92953 new daily cases last week.*
In the double vaccinated population cases continue to rise slightly and it’s estimated there are currently 27980 new daily symptomatic cases in the UK up from 26927 cases last week (Graph 1).
The UK R value is estimated to be around 1.0 and regional R values are; England, 1.0, Wales, 1.0, Scotland, 1.0 (Table 1).
The ZOE incidence data is always a week ahead of the other surveillance surveys and continues to work as an early warning signal. The ZOE data has been reporting a recent downturn in cases for the last week and while the latest ONS figures are yet to reflect this trend, this is an indication that we are as usual ahead of other surveys (Graph 5).
In terms of prevalence, on average 1 in 53 people in the UK currently have symptomatic COVID. In the regions, England, 1 in 52. Wales,1 in 42. Scotland, 1 in 81. (Table 1).
The number of daily new cases is showing a clear decline in cases in 0-18 year olds. Most other age groups are showing signs of levelling off. The only age group with climbing cases is the more vulnerable 55-75 year old bracket, which is cause for concern (Graph 2).
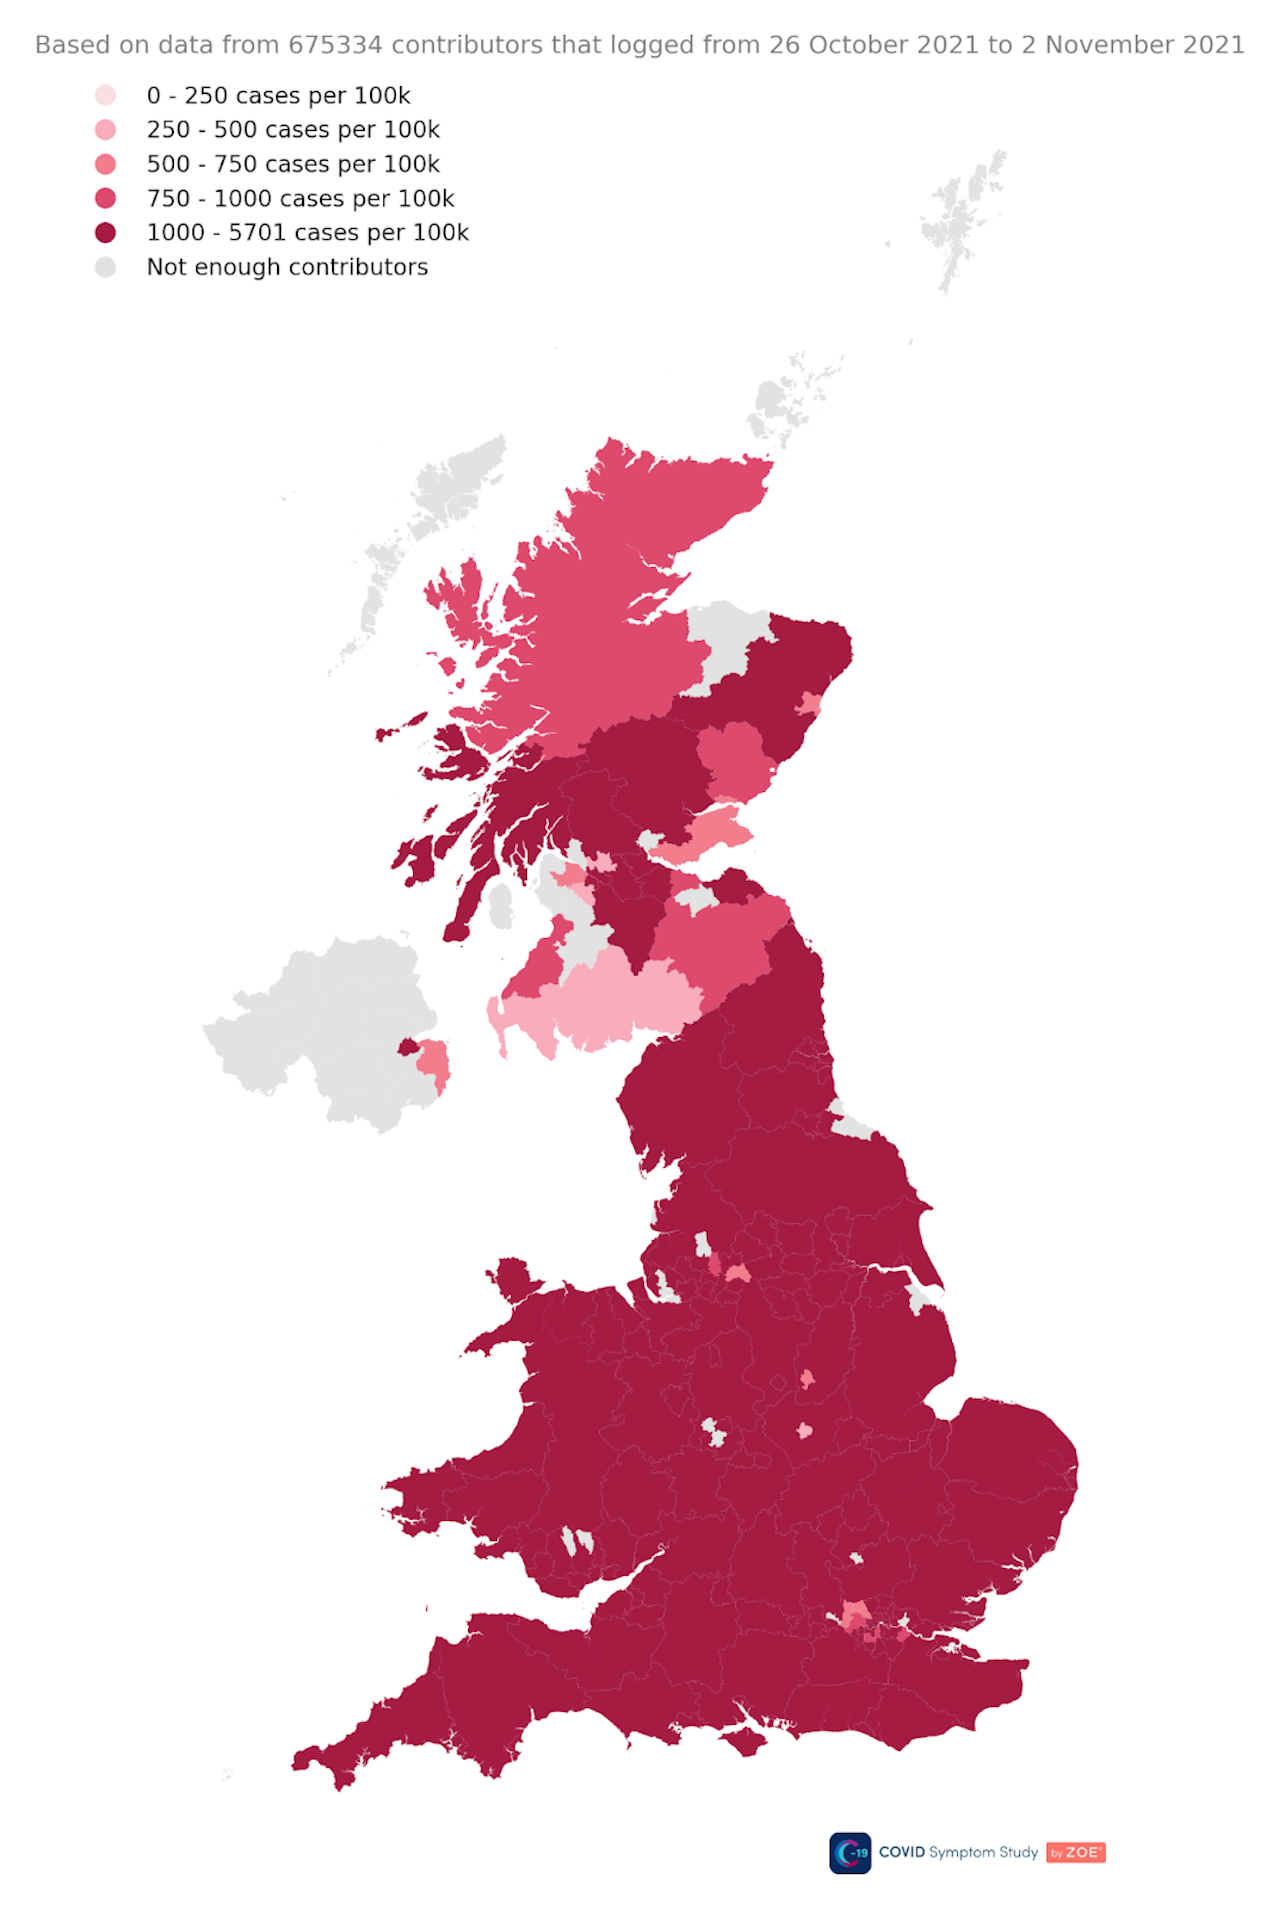
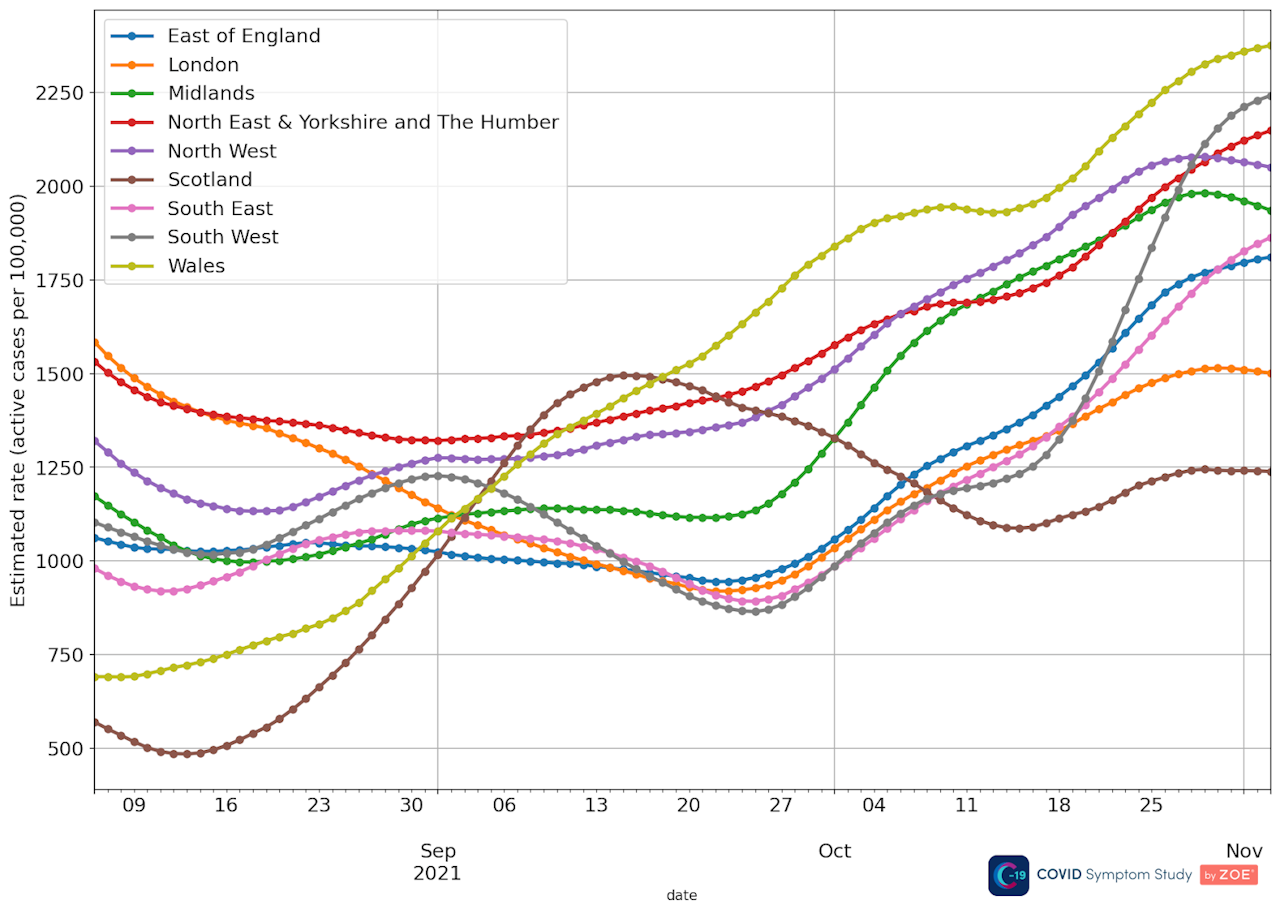
In terms of prevalence, cases are highest in Midlands, South East and North East. (Graph 3).
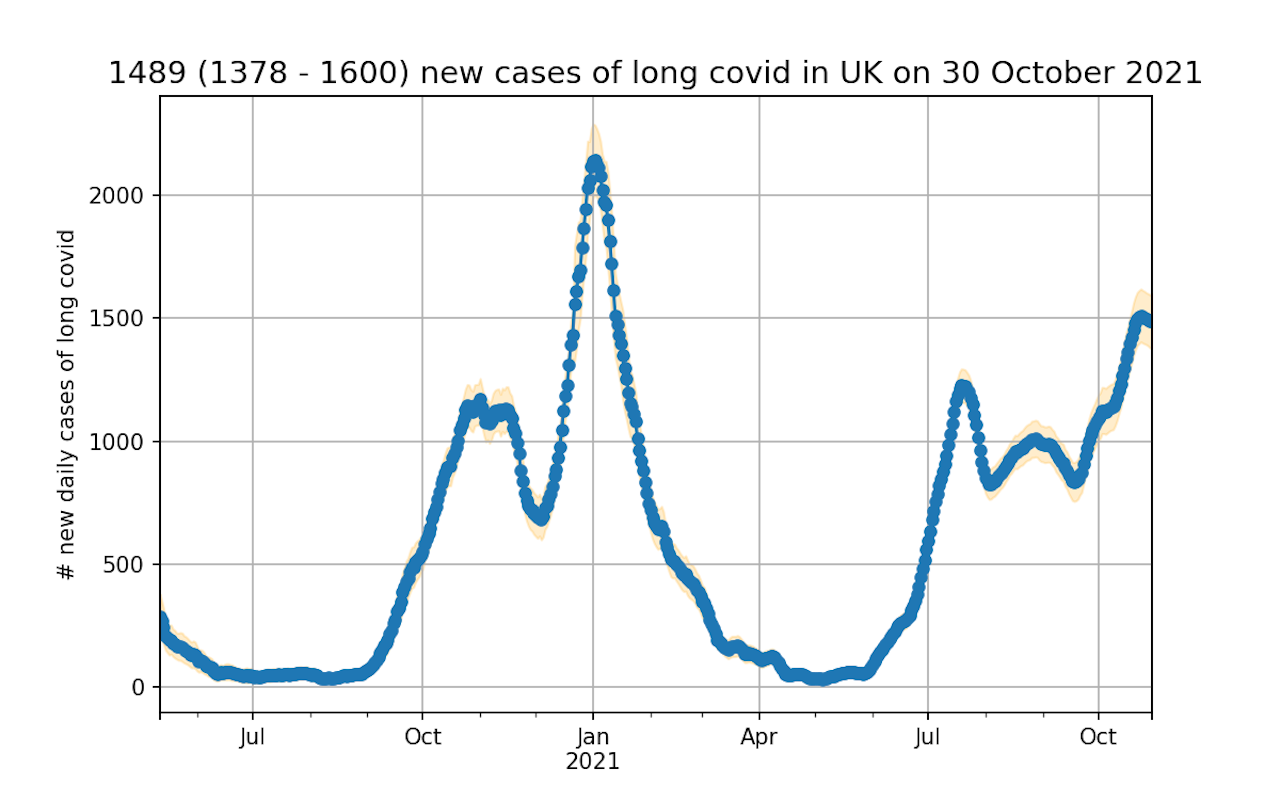
ZOE’s predicted Long COVID incidence rate currently estimates, at current case rates, 1,489 people a day will go on to experience symptoms for longer than 12 weeks (Graph 4).
The ZOE COVID Study incidence figures (new symptomatic cases) are based on reports from around 750,000 thousand weekly contributors and the proportion of newly symptomatic users who have received positive swab tests. The latest survey figures were based on data from 42,359 recent swab tests done between 16 October and 30 October 2021.
Professor Tim Spector, lead scientist on the ZOE COVID Study app, comments on the latest data:
“It’s great that we’re finally seeing cases start to come down, and hopefully we’re over the last great peak of COVID in 2021. This is driven in large part by declining cases in children who have been on half term holidays and by high rates of previous infection, but we’re hopeful that the trend will continue.
It’s still worrying that cases in the older, more vulnerable age group are increasing, but as the booster programme continues to roll out we’re likely to see this come down as well.
As the temperatures drop and winter comes we’re still seeing far too much COVID in the community leading to high Long COVID and hospitalisation rates compared to other countries in Western Europe. With high rates of other viral respiratory illnesses too (although no flu yet), there is no room for complacency.
The high rates of cases are levelling off in most UK regions, with Scotland remaining low and Wales the high extremes. Ireland has higher vaccination rates than the UK, but lifted its restrictions and has seen cases rise. While restrictions, masks and vaccine uptake in children are factors, it’s clear that there’s no single solution to bringing rates down permanently. We’ve seen that a combination of population safety precautions and vaccines works best, and so the third booster vaccine, coupled with mask wearing and distancing in high risk areas, is our way out.”
Graph 1. The ZOE COVID Study UK incidence figures results over time; total number of new cases and new cases in fully vaccinated

Graph 2. Incidence by age group


Graph 3. Prevalence rate by region

Graph 4. Predicted Long COVID incidence over time
Please refer to the publication by Thompson at al. (2021) for details on how long covid rates in the population are modelled

Graph 5. A comparison of prevalence figures; ZOE COVID Study, and other COVID surveillance studies


Table 1. Incidence (daily new symptomatic cases)[*], R values and prevalence regional breakdown table

Map of UK prevalence figures