Updated 9th April 2022
This article has not been updated recently
Biggest drop in cases since start of winter wave


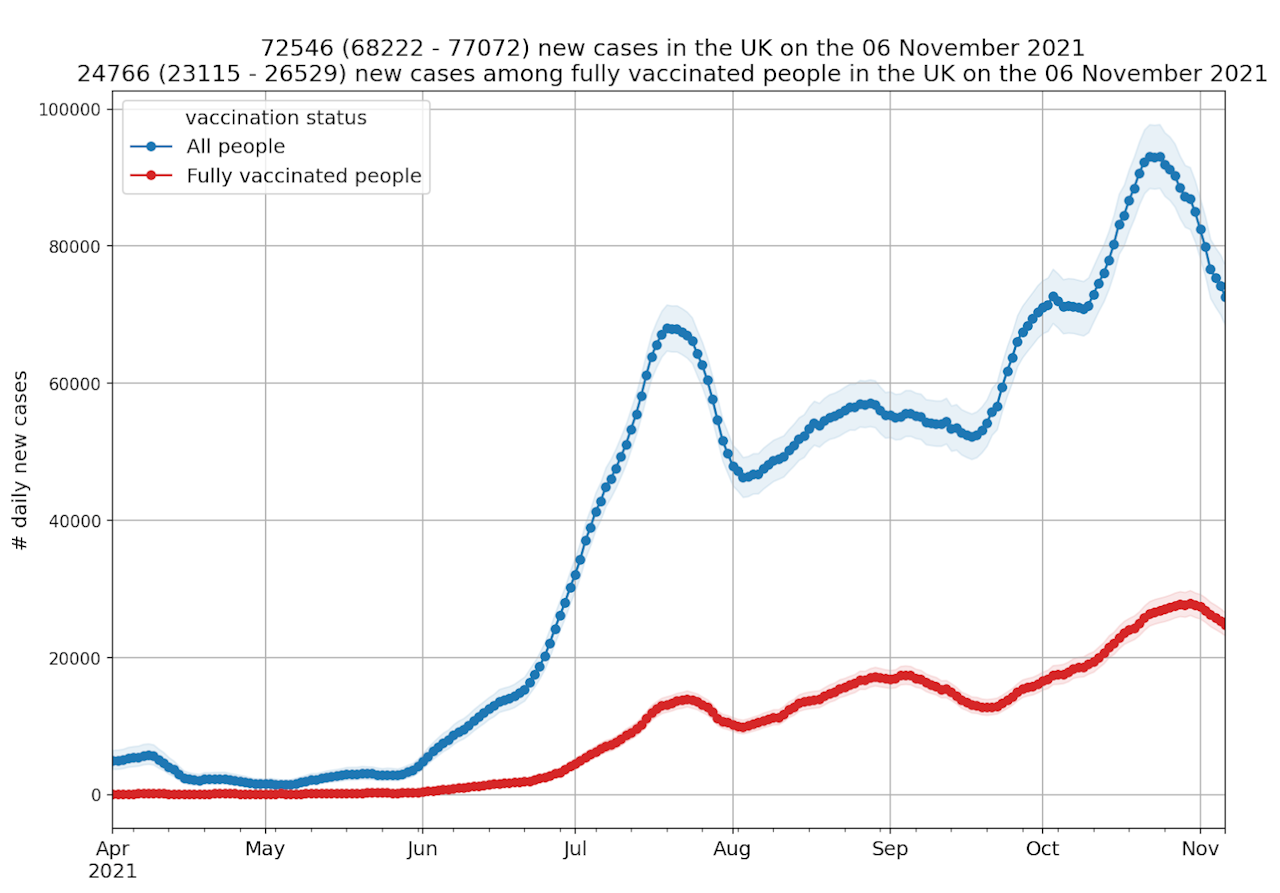
According to ZOE COVID Study incidence figures, in total there are currently 72,546 new daily symptomatic cases of COVID in the UK on average, based on PCR and LFT test data from up to five days ago [*]. A decrease of 18% from 88,592 new daily cases last week.
In the vaccinated population (at least two doses) cases are dropping more slowly and it’s estimated there are currently 24,766 new daily symptomatic cases in the UK. A decrease of 11.5% from 27,980 new daily cases last week (Graph 1).
The UK R value is estimated to be around 0.9 and regional R values are; England, 0.9, Wales, 0.9, Scotland, 1.0 (Table 1).
The ZOE incidence data is always a week ahead of the other surveillance surveys and continues to work as an early warning signal. The ZOE data has been reporting a downturn in cases for the past two weeks, the latest ONS figures are yet to reflect this trend. (Graph 5).
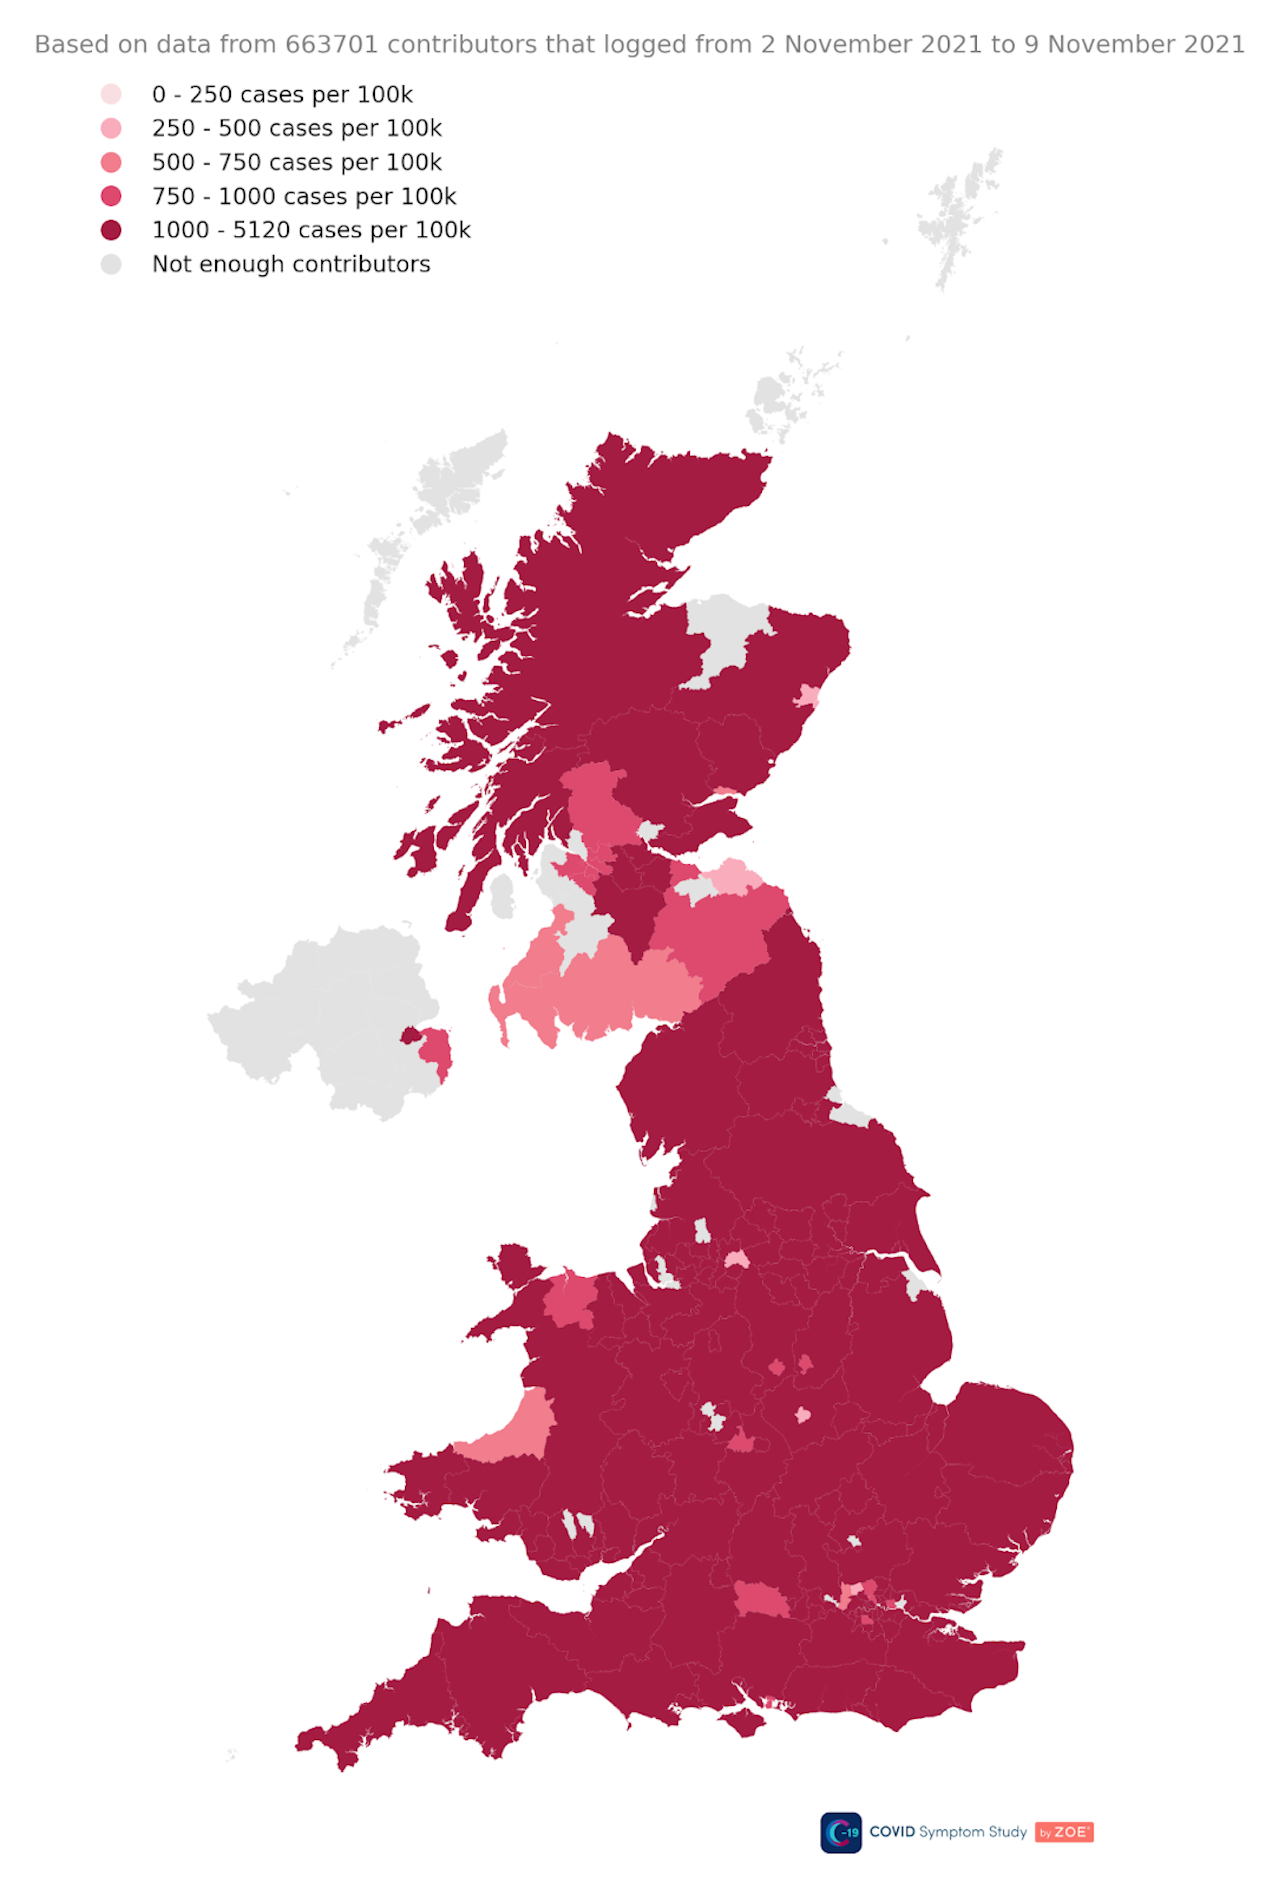
In terms of prevalence, on average 1 in 58 people in the UK currently have symptomatic COVID. In the regions, England, 1 in 57. Wales,1 in 47. Scotland, 1 in 84. (Table 1).
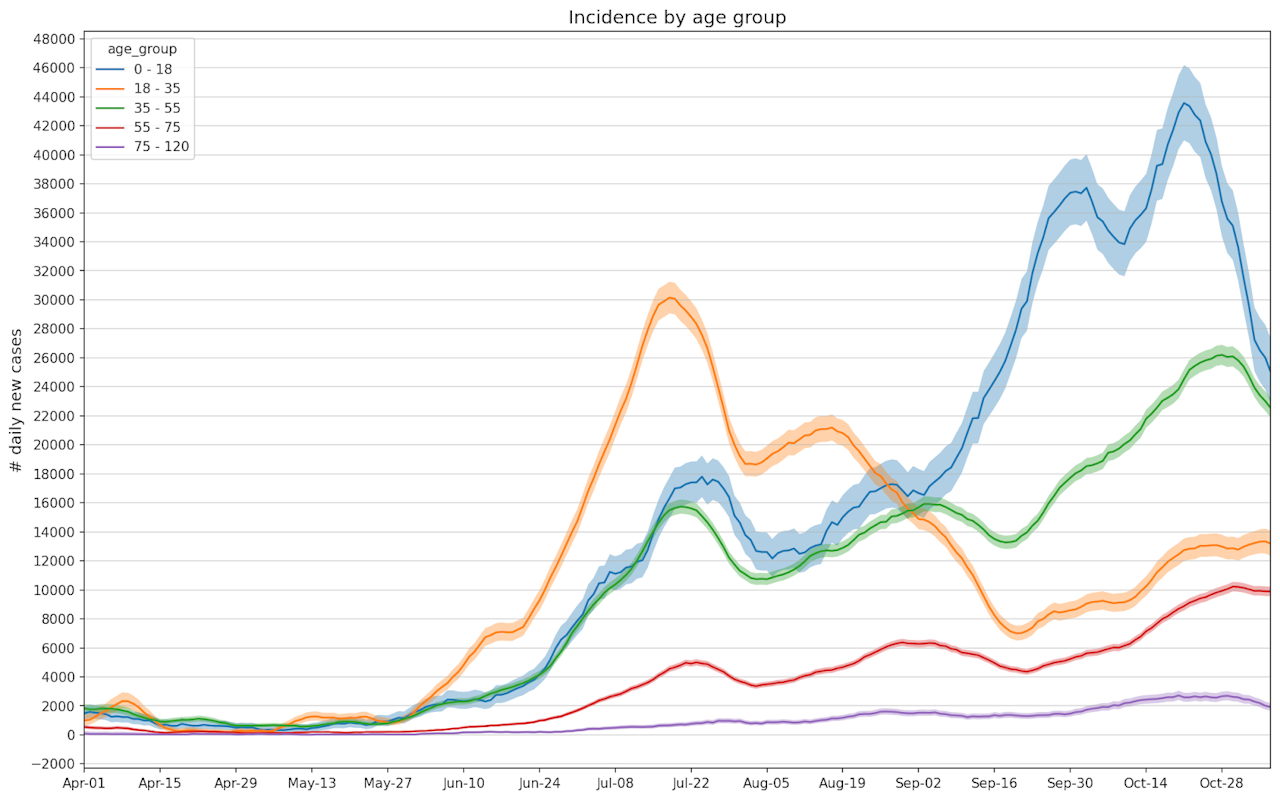
The number of daily new cases continues to show a steep decline in cases among 0-18 year olds, which is the driving group behind both the initial increases and the recent fall in overall case numbers. Cases in 20-29 year olds are still increasing but cases have started to fall in the 35-55 year age group. Cases among those over 55 are levelling off. (Graph 2).
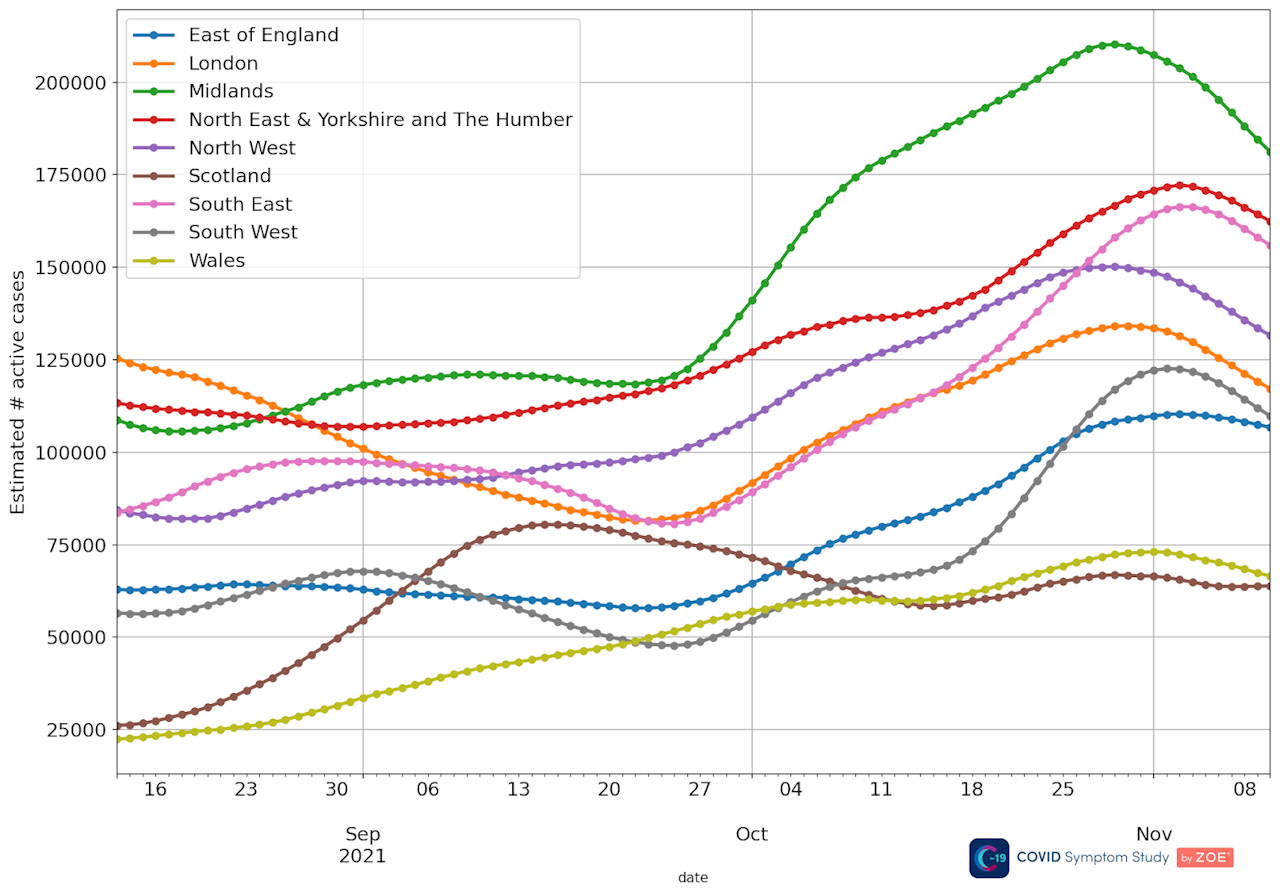
In terms of prevalence, cases are highest in the Midlands, South East and North East but prevalence is falling in those areas (Graph 3).
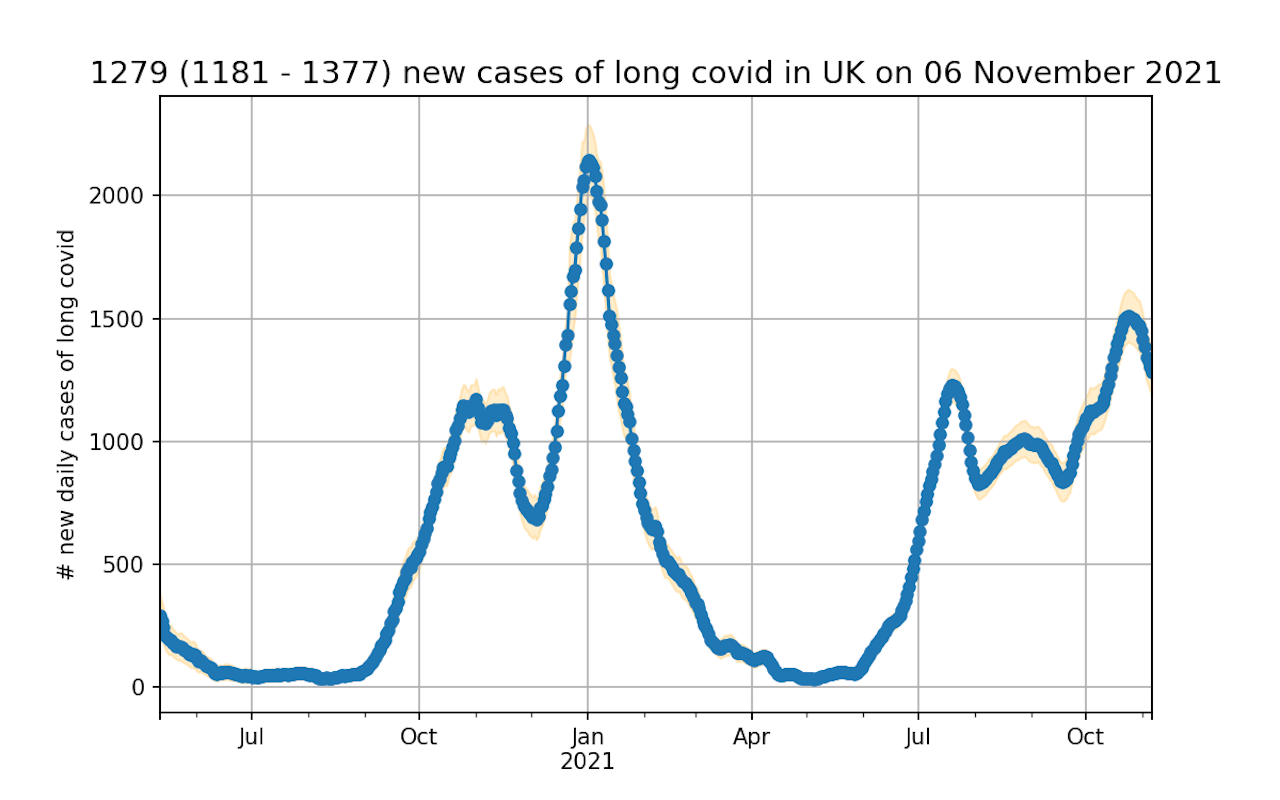
ZOE’s predicted Long COVID incidence rate currently estimates, at current case rates, 1,279 people a day will go on to experience symptoms for longer than 12 weeks. This number continues to fall in line with the overall incidence figures (Graph 4).
The ZOE COVID Study incidence figures (new symptomatic cases) are based on reports from around 750,000 thousand weekly contributors and the proportion of newly symptomatic users who have received positive swab tests. The latest survey figures were based on data from 40,100 recent swab tests done between 23 October and 6 November 2021.
Professor Tim Spector, lead scientist on the ZOE COVID Study app, comments on the latest data:
“This drop in cases is the largest weekly decline we’ve seen all year, and is being driven by a sustained fall in cases among children over the last two weeks. However, cases are still high and, worryingly, we’re still seeing high death rates as COVID takes up to 8% of hospital beds.
As we head into the colder months, we’re seeing a lot of sickness in the population with widespread outbreaks of colds and still high levels of COVID. Knowing the difference between the two is harder than ever, as cases in the vaccinated are mild and include symptoms like sneezing, headache and a runny nose and can be easily transmitted to family members or work colleagues. To keep numbers down it’s crucial for everyone eligible to get their booster jabs, even if they have recently had a COVID infection, as we’ve shown natural infections do not always produce an immune response and protection. We know from our research that the vaccines (given in 3 doses) provide the greatest possible protection against contracting the virus, and being admitted to hospital with more serious symptoms.”
Graph 1. The ZOE COVID Study UK incidence figures results over time; total number of new cases and new cases in fully vaccinated

Graph 2. Incidence by age group

Graph 3. Prevalence rate by region

Graph 4. Predicted Long COVID incidence over time
Please refer to the publication by Thompson at al. (2021) for details on how long covid rates in the population are modelled
Graph 5. A comparison of prevalence figures; ZOE COVID Study, and other COVID surveillance studies

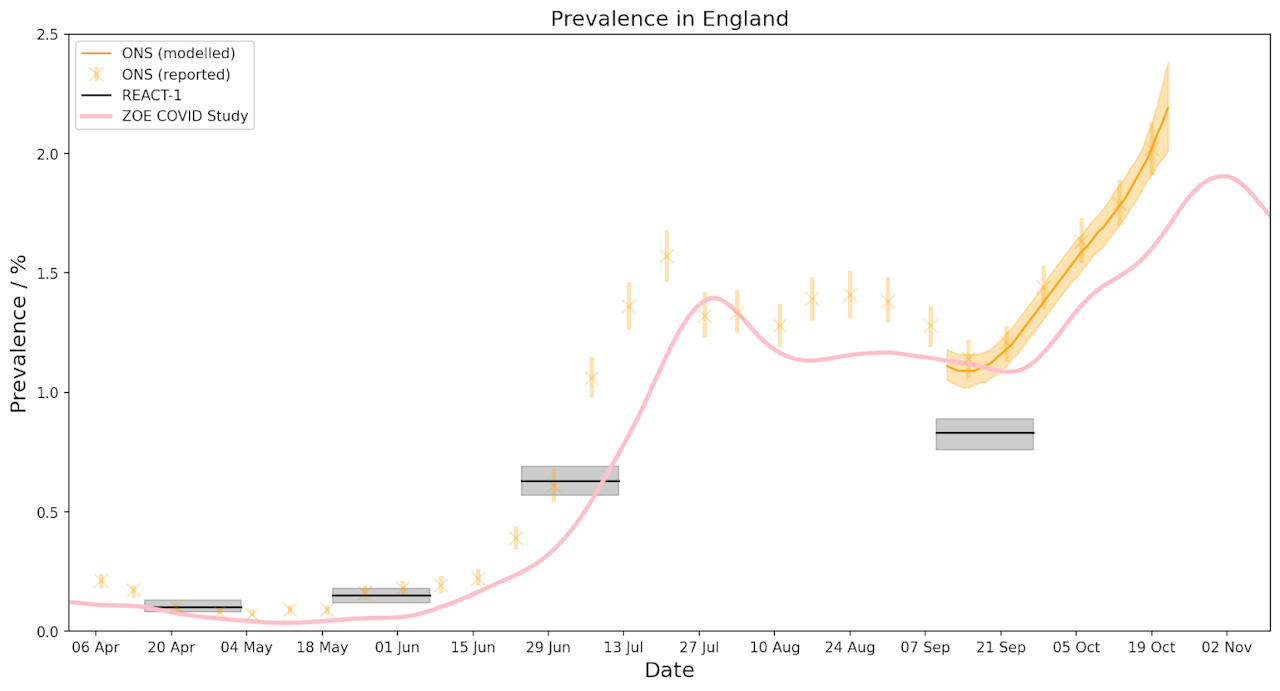
Table 1. Incidence (daily new symptomatic cases)[*], R values and prevalence regional breakdown table
Map of UK prevalence figures